Data Management in Flows
Danomics is actively developing a number of data management tools to help you get your data ready to interpret faster than ever before. In this video I’ll review how you can use these tools to understand if there are structural problems in the format of your LAS data, understand your curve mnemonics, and perform a simple cleaning operation. In this video we’ll be using the following blocks in Danomics Flows (File >> New Flow…):
- LogHealthCheck – This tool will be used to evaluate structural problems in your LAS files
- MnemonicsAnalysis – This tool will be used to evaluate the coverage of your Mnemonics in the alias table
- NullRepeatedLogSamples – this tool will be used to remove repeated values from your well logs
This video (17 minutes) will cover all three tool types. More information, including screenshots from this demo can be found below.
Log Health Check Tool
The output from the LogHealthCheck tool is accessed by clicking on the job log icon (sheet of paper). The report will list all issues noticed on a well-by-well basis as well as a summary view at the end of the report, as shown here:
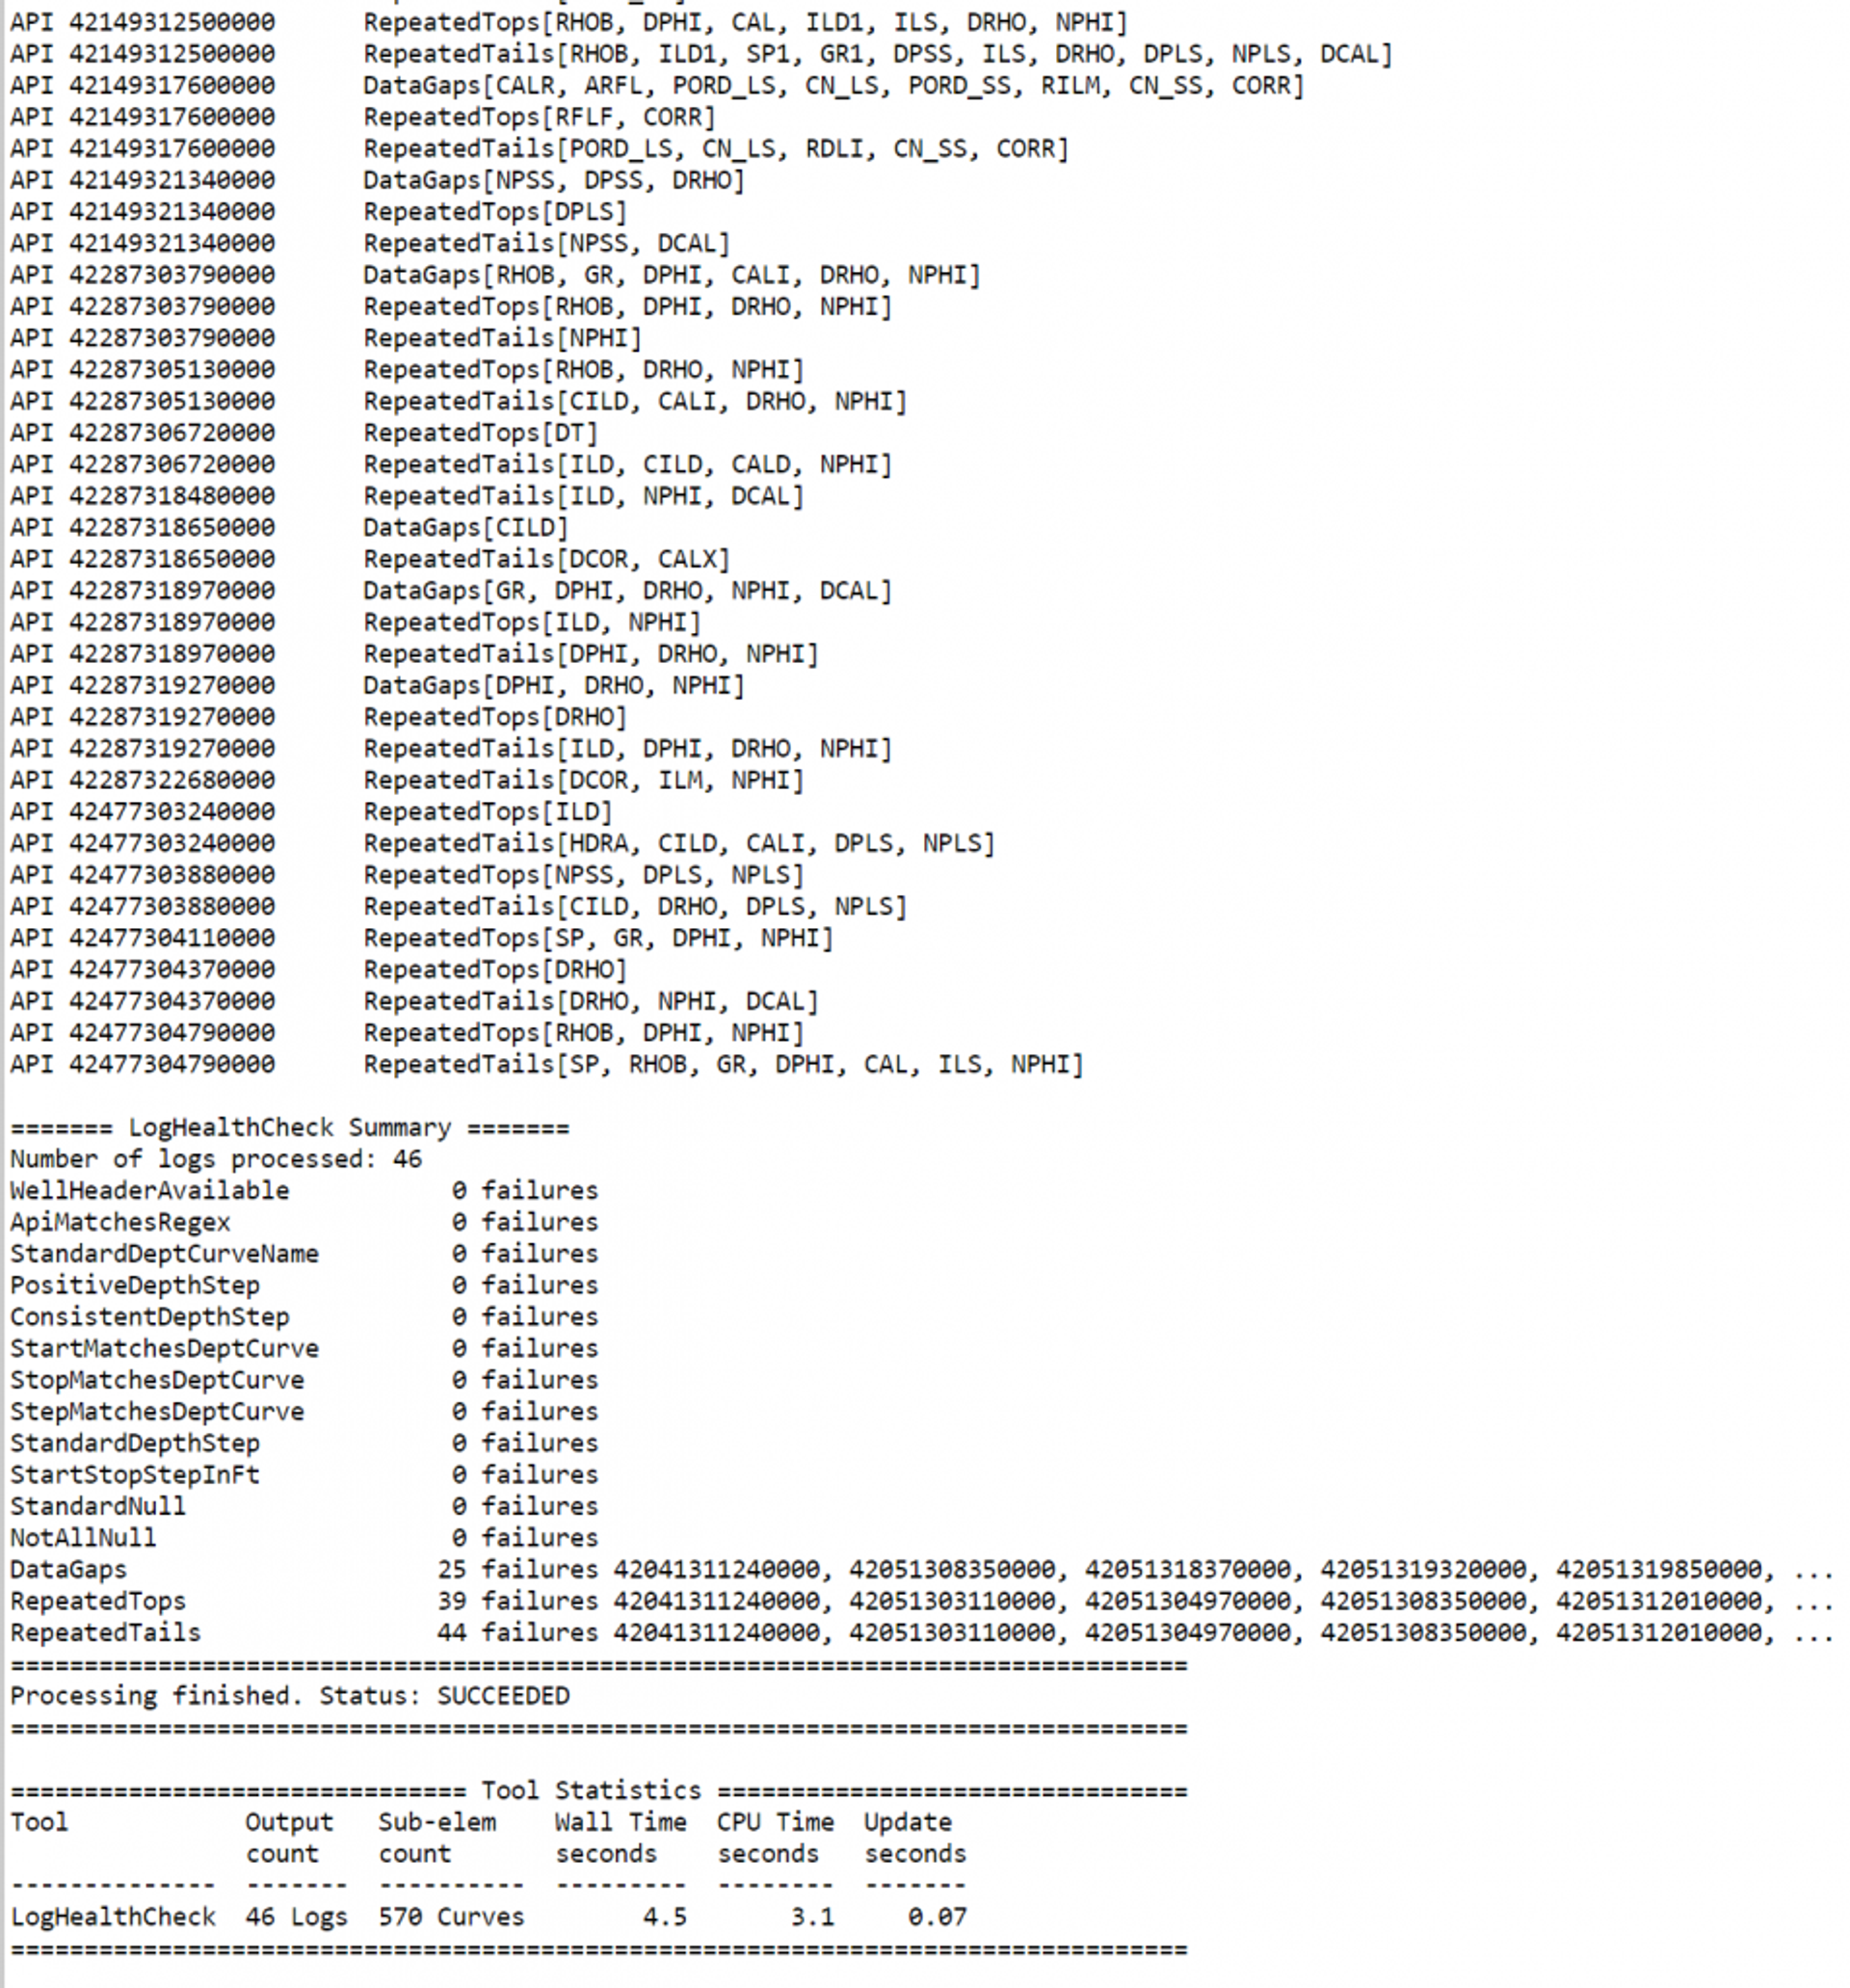
One useful trick if you want to just see all of the wells that encountered a specific problem is to choose to only run a single check by clicking on the “Selected” option in the “Checks” radio group.
Mnemonics Analysis
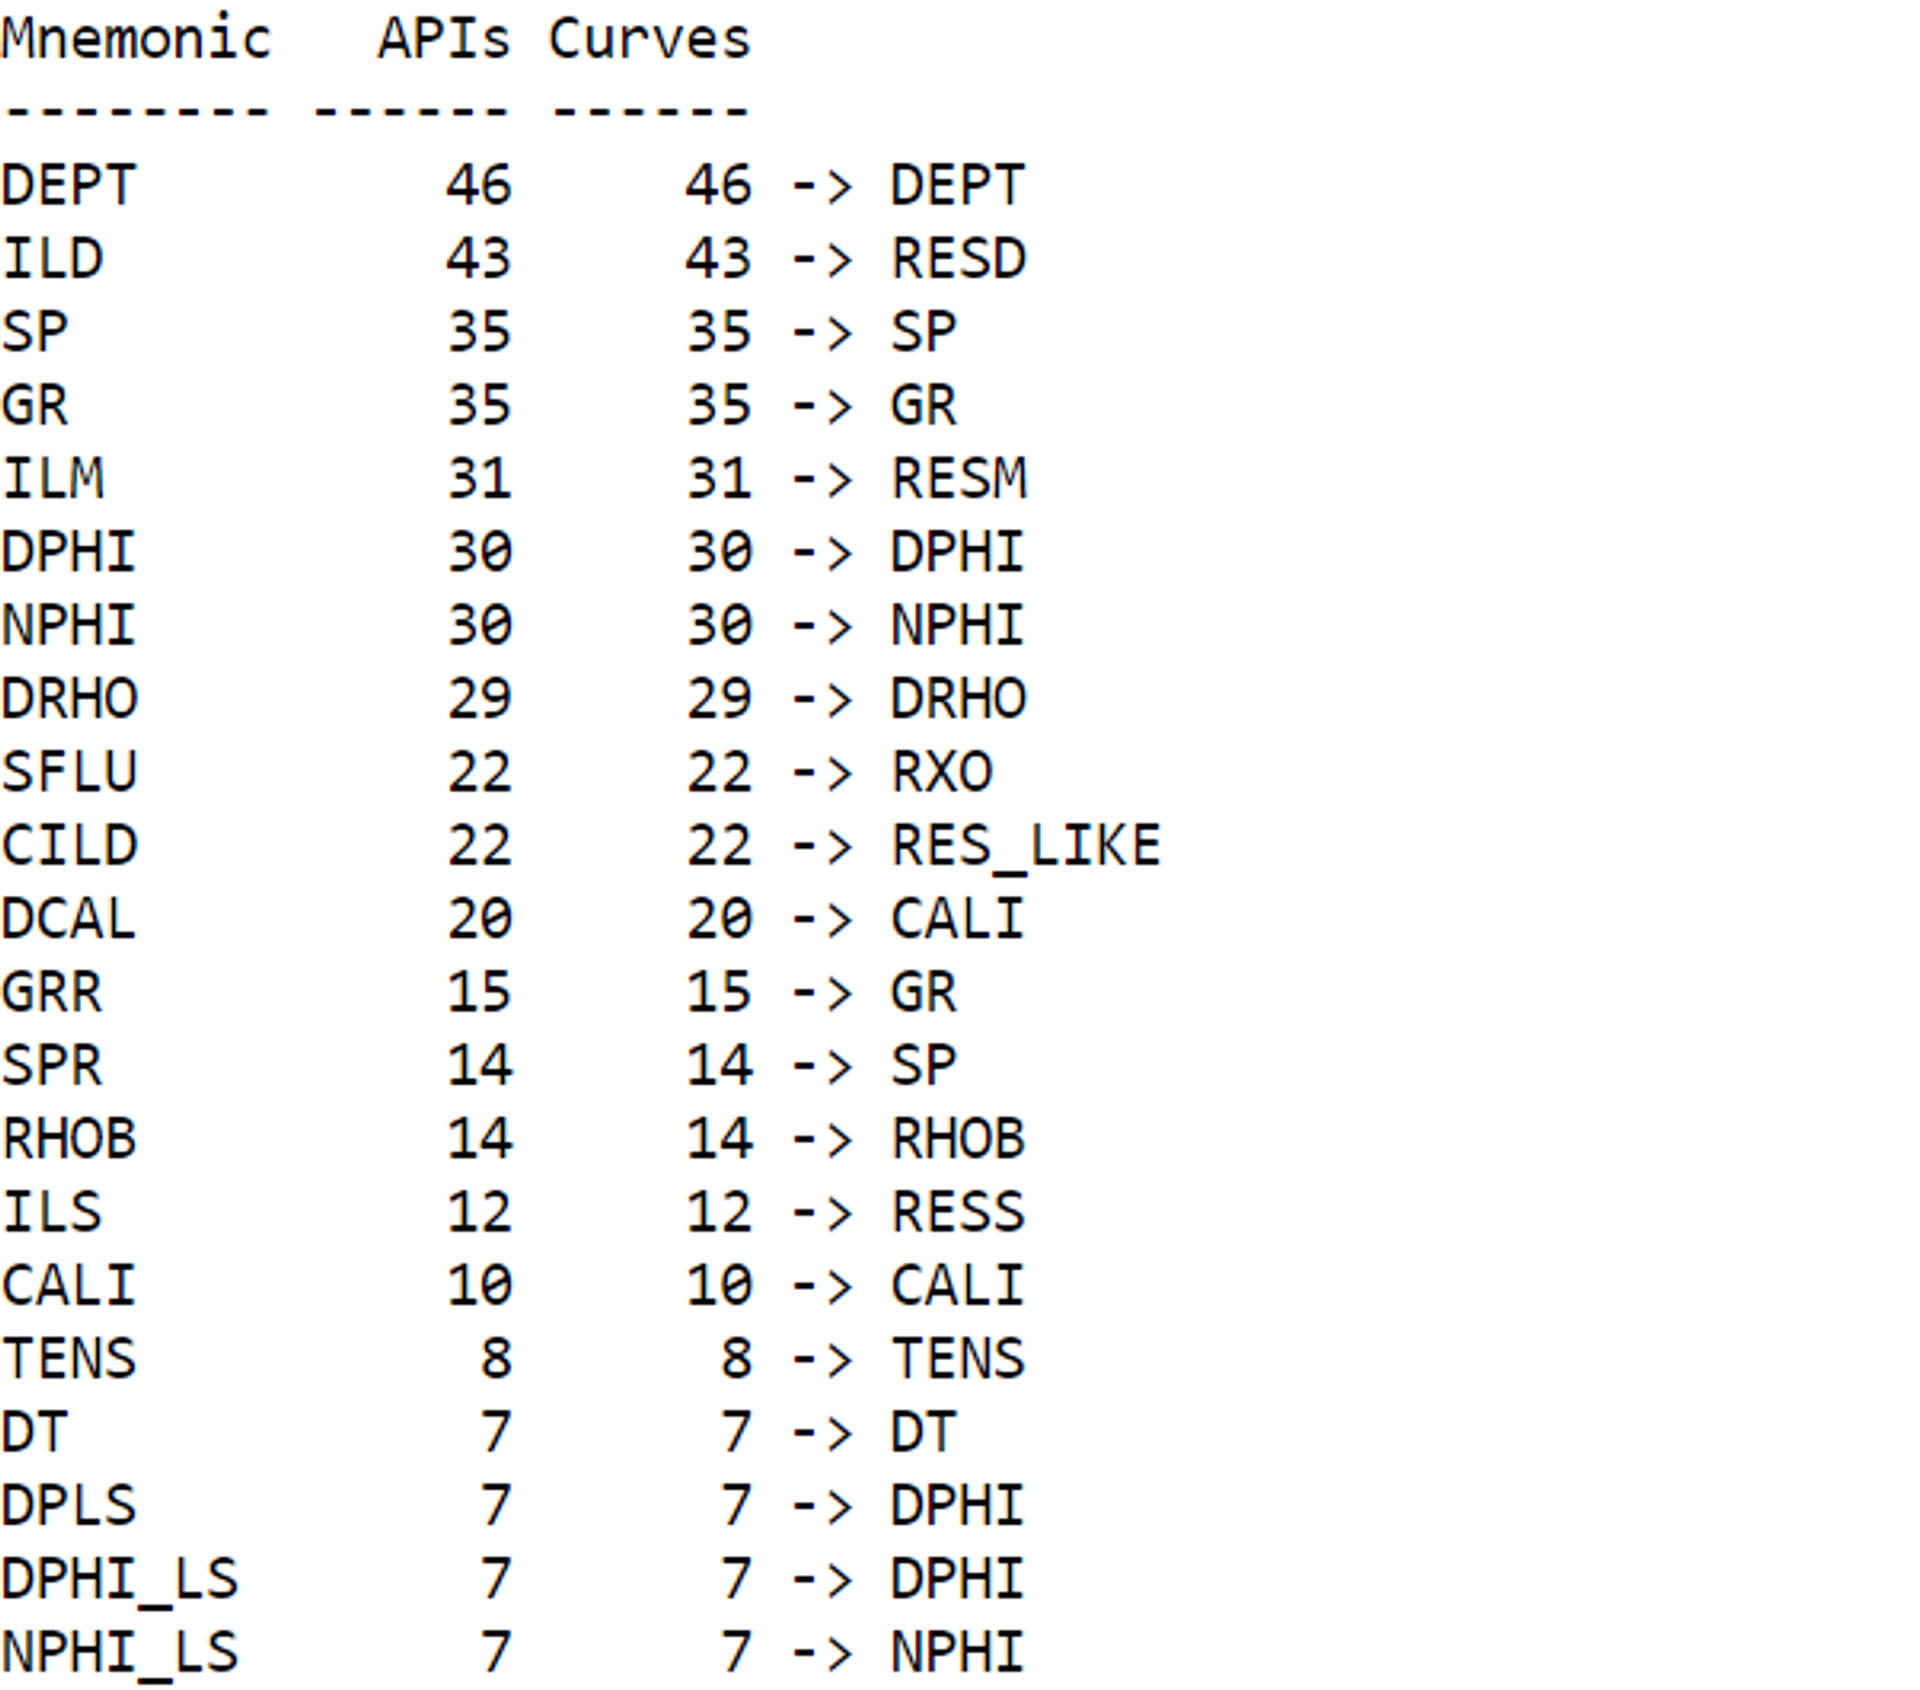
In the Mnemonics Analysis tool we evaluate how many of each curve type there are present in your log database as well as what those mnemonics are aliased to. Running this tool is a useful way to understand if some of your data may not be getting used in your petrophysical analyses and if you need to modify the default alias table. To use this tool you’ll first create a new flow (File >> New Flow). Next you’ll add a LogInput block and a MnemonicsAnalysis Block. Finally, once the job runs, you’ll access the report (as shown below) by clicking on the job log icon in the Jobs menu.
Tags
Related Insights
DCA: Type well curves
In this video I demonstrate how to generate a well set filtered by a number of criteria and generate a multi-well type curve. Before starting this video you should already know how to load your data and create a DCA project. If not, please review those videos. Type well curves are generated by creating a decline that represents data from multiple wells.
DCA: Loading Production data
In this video I demonstrate how to load production and well header data for use in a decline curve analysis project. The first step is to gather your data. You’ll need: Production data – this can be in CSV, Excel, or IHS 298 formats. For spreadsheet formats you’ll need columns for API, Date, Oil, Gas, Water (optional), and days of production for that period (optional). Well header data – this can be in CSV, Excel, or IHS 297 formats.
Sample data to get started
Need some sample data to get started? The files below are from data made public by the Wyoming Oil and Gas Commission. These will allow you to get started with petrophysics, mapping, and decline curve analysis. Well header data Formation tops data Deviation survey data Well log data (las files) Production data (csv) or (excel) Wyoming counties shapefile and projection Wyoming townships shapefile and projection Haven’t found the help guide that you are looking for?