Example Flow: Grid Math
This article outlines how to use Flows to perform simple mathematical operations on a grid. This requires using three flows building blocks:
- GridInput
- GridMath
- GridOutput
The assembled flow is shown below:
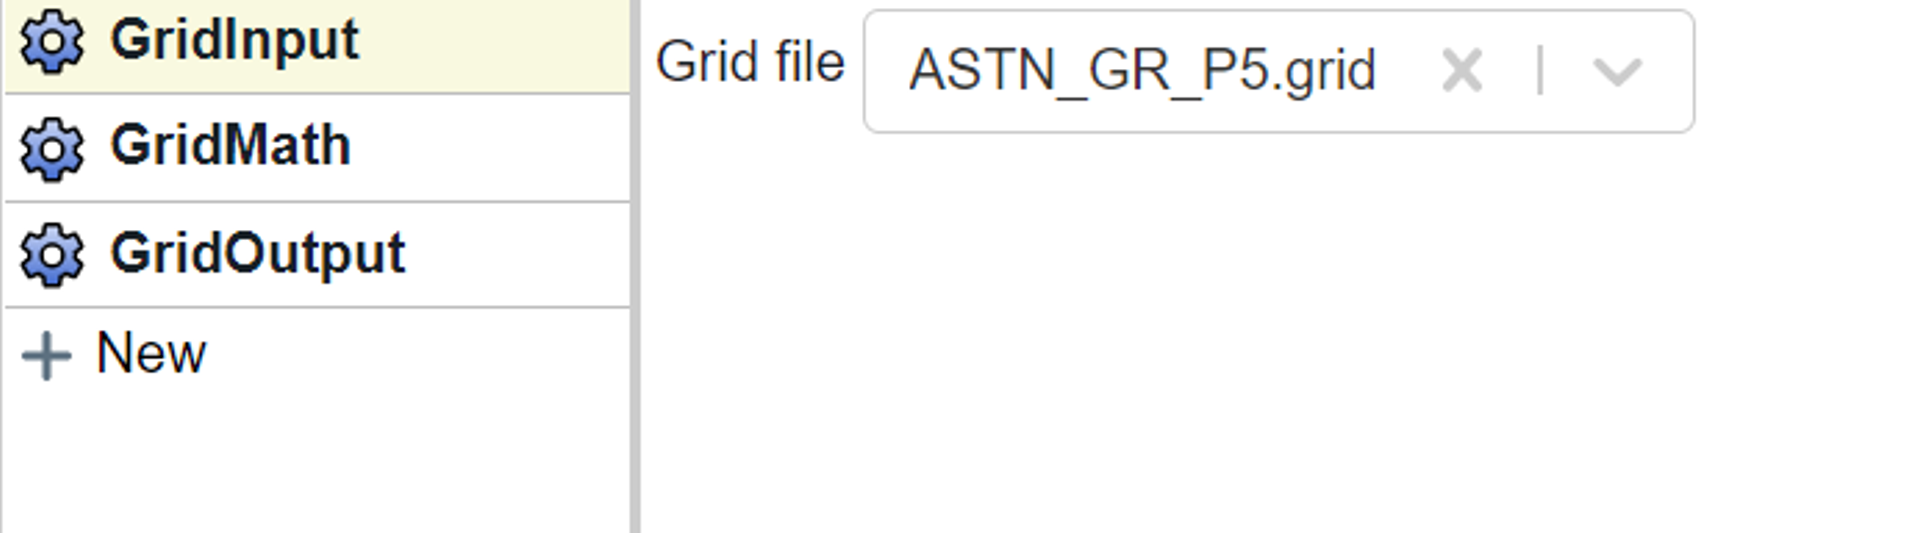
In the GridInput I choose a previously generated grid.
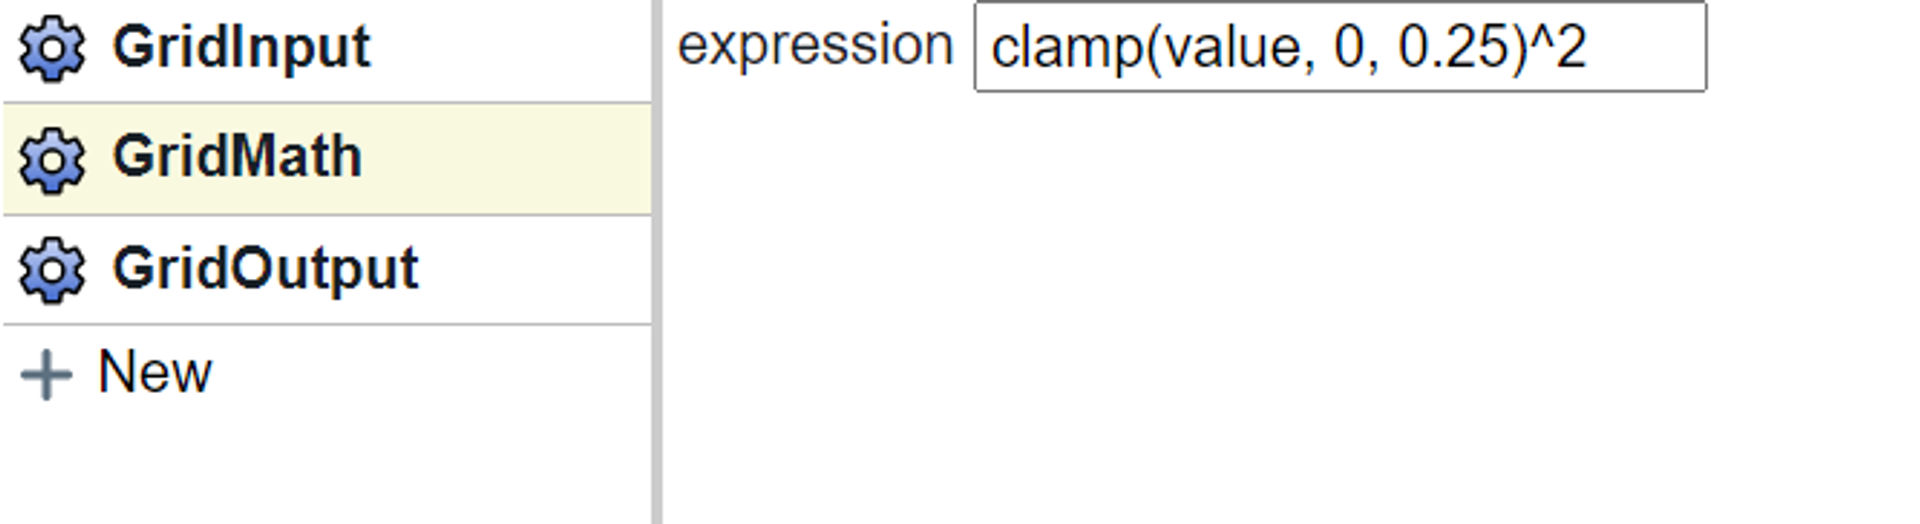
In the GridMath I enter a formula. In this case we use the protected “value” key word. I used the following expression:
clamp(value, 0, 0.25)^2
This clamps the value of he grid to be between 0 and 0.25 and then squares that value. This expression has no importance, but I wanted to demonstrate the operation of clamping the values and then doing additional math on top of that (in this case squaring the value).
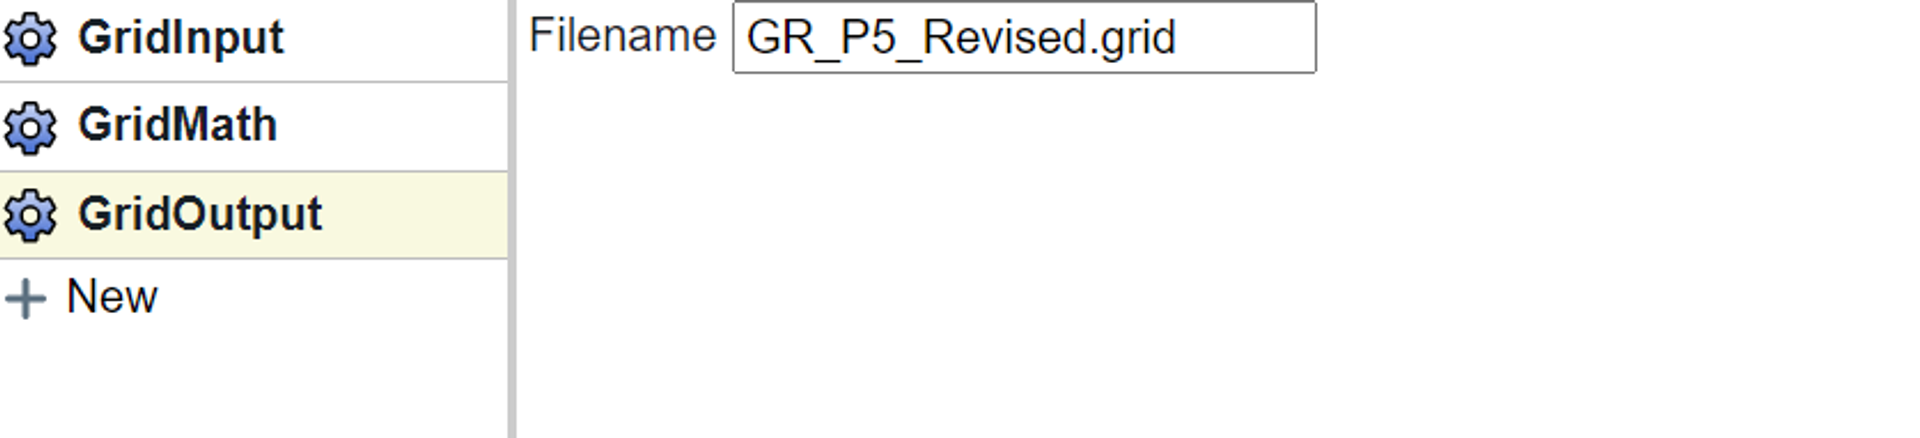
And finally we write out the new grid using the GridOutput block. Note that they grid will be written to the folder that contains the flow.
Tags
Related Insights
DCA: Type well curves
In this video I demonstrate how to generate a well set filtered by a number of criteria and generate a multi-well type curve. Before starting this video you should already know how to load your data and create a DCA project. If not, please review those videos. Type well curves are generated by creating a decline that represents data from multiple wells.
DCA: Loading Production data
In this video I demonstrate how to load production and well header data for use in a decline curve analysis project. The first step is to gather your data. You’ll need: Production data – this can be in CSV, Excel, or IHS 298 formats. For spreadsheet formats you’ll need columns for API, Date, Oil, Gas, Water (optional), and days of production for that period (optional). Well header data – this can be in CSV, Excel, or IHS 297 formats.
Sample data to get started
Need some sample data to get started? The files below are from data made public by the Wyoming Oil and Gas Commission. These will allow you to get started with petrophysics, mapping, and decline curve analysis. Well header data Formation tops data Deviation survey data Well log data (las files) Production data (csv) or (excel) Wyoming counties shapefile and projection Wyoming townships shapefile and projection Haven’t found the help guide that you are looking for?