Example Flow: Points Math
This article outlines how to use Flows to perform a simple operation on a points database. This example uses three flows building blocks:
- PointsInput
- PointsMath
- PointsOutput
The assembled flow is shown below:
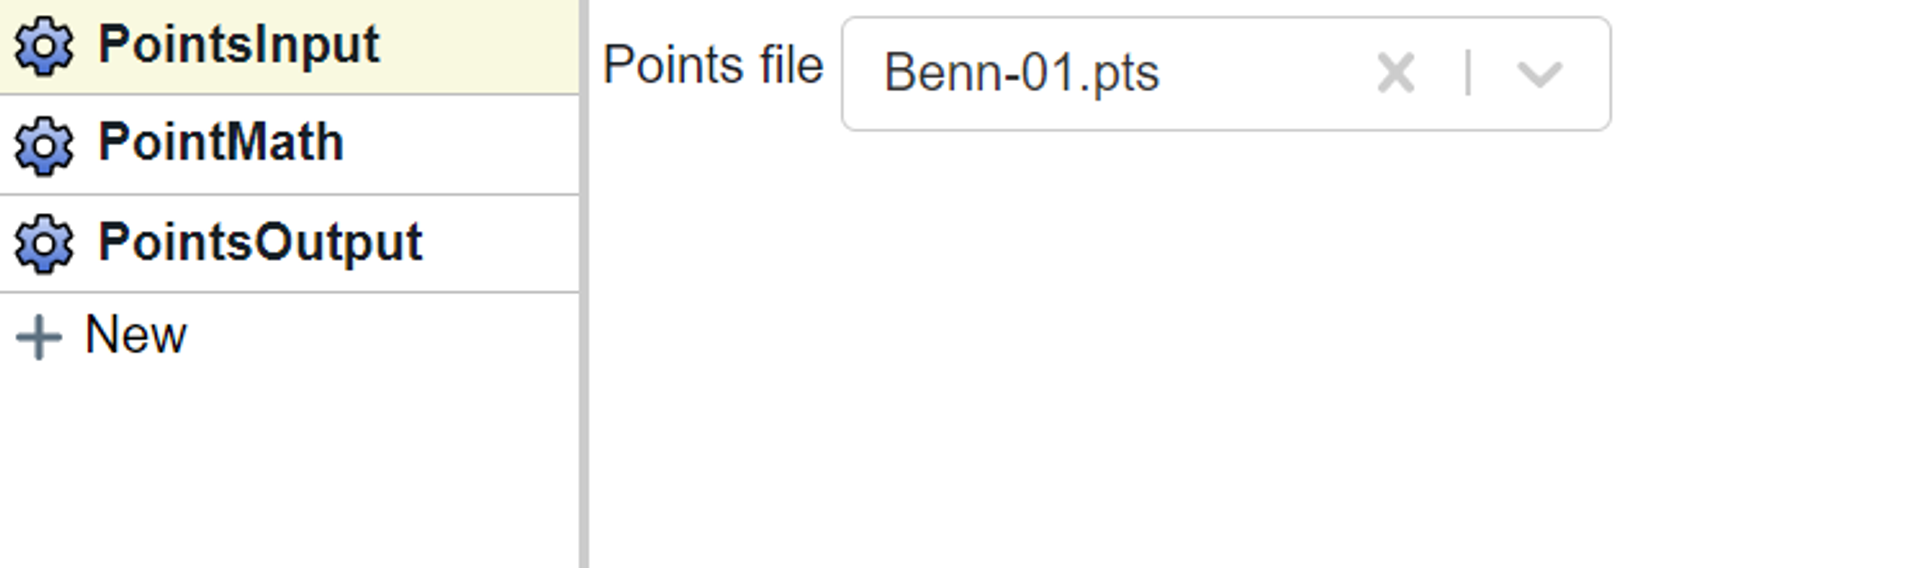
In the PointsInput you select a points database. In this case I have selected a small database shown below.
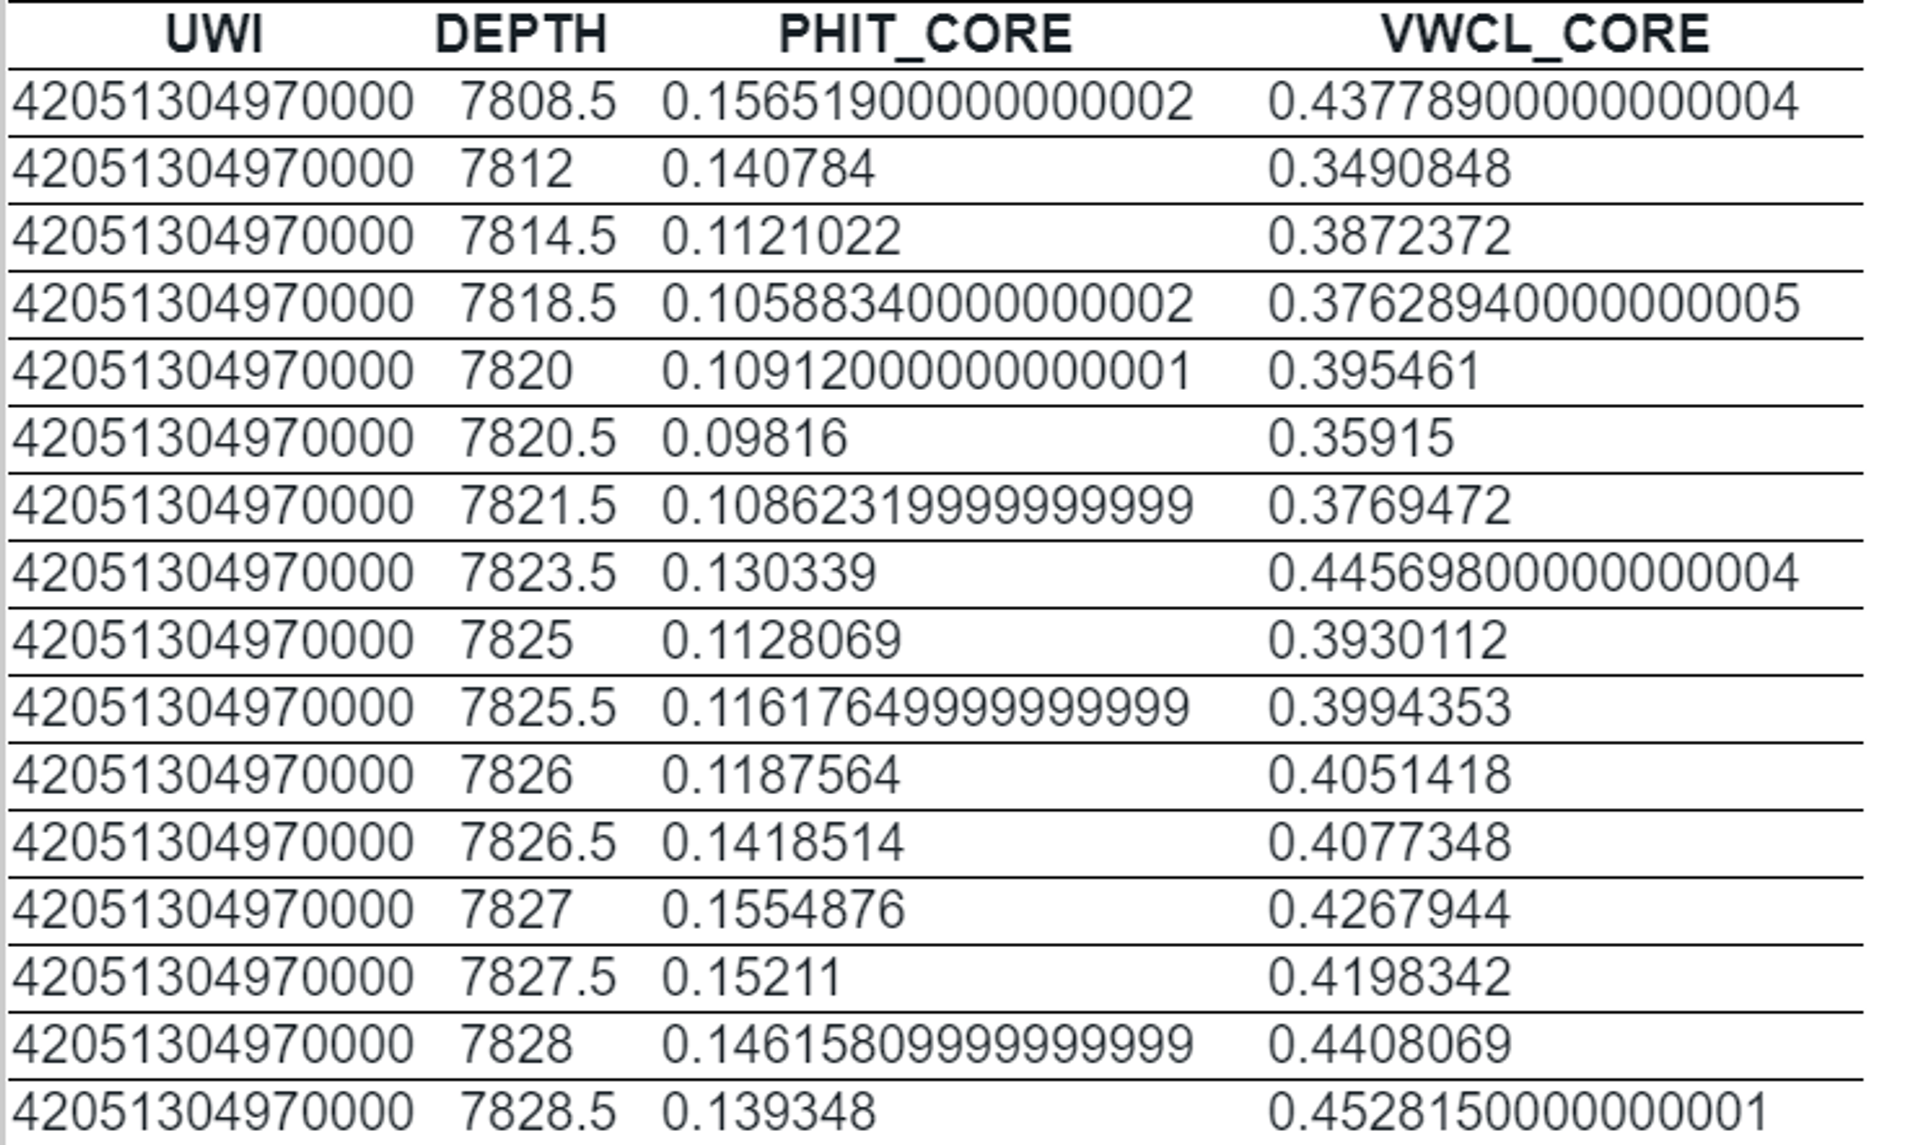
In this example, my PHIT_CORE property is in decimal, and I would like it to be in percent. Instead of going back to Excel or a similar outside editor, I have chosen to do this in Flows.
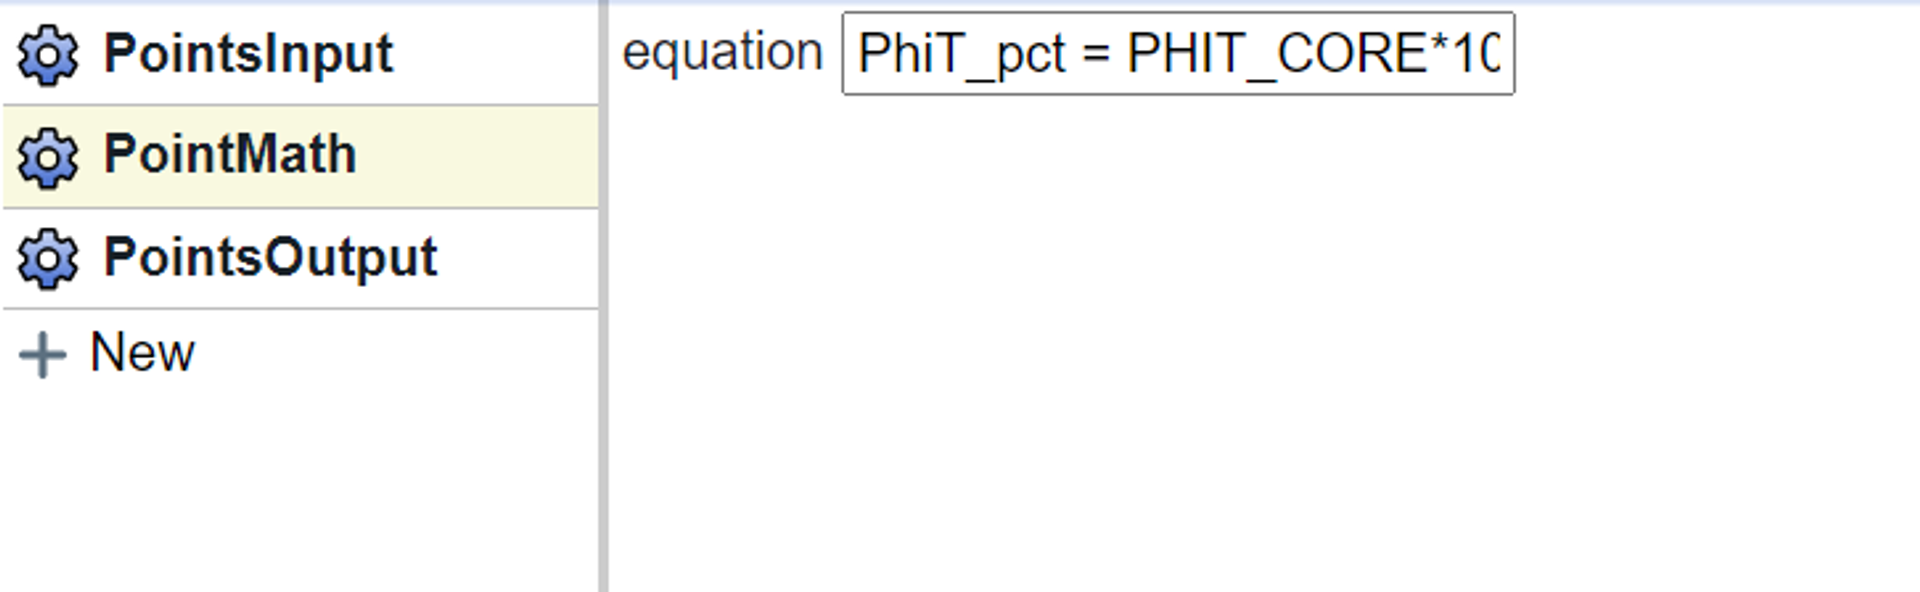
In the PointsMath I use the following equation:
PhiT_pct = PHIT_CORE*100
PhiT_pct is the column I am creating and PHIT_CORE is my existing column name. Note that you can use multiple columns in your equation if desired (e.g., add two columns together).
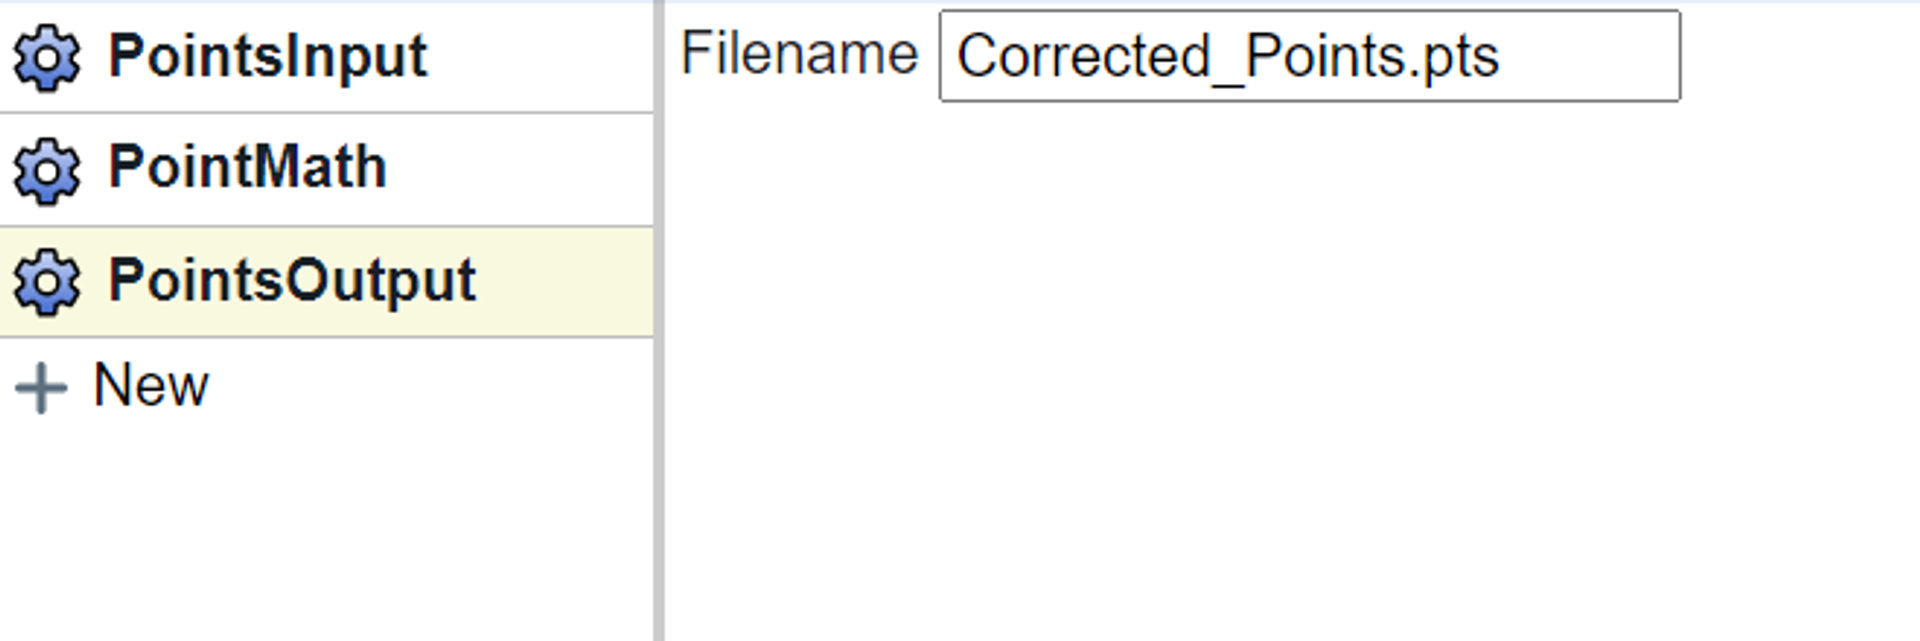
In the PointsOutput I provide a name for the new points database I wish to create. A screenshot of the updated database is shown below:
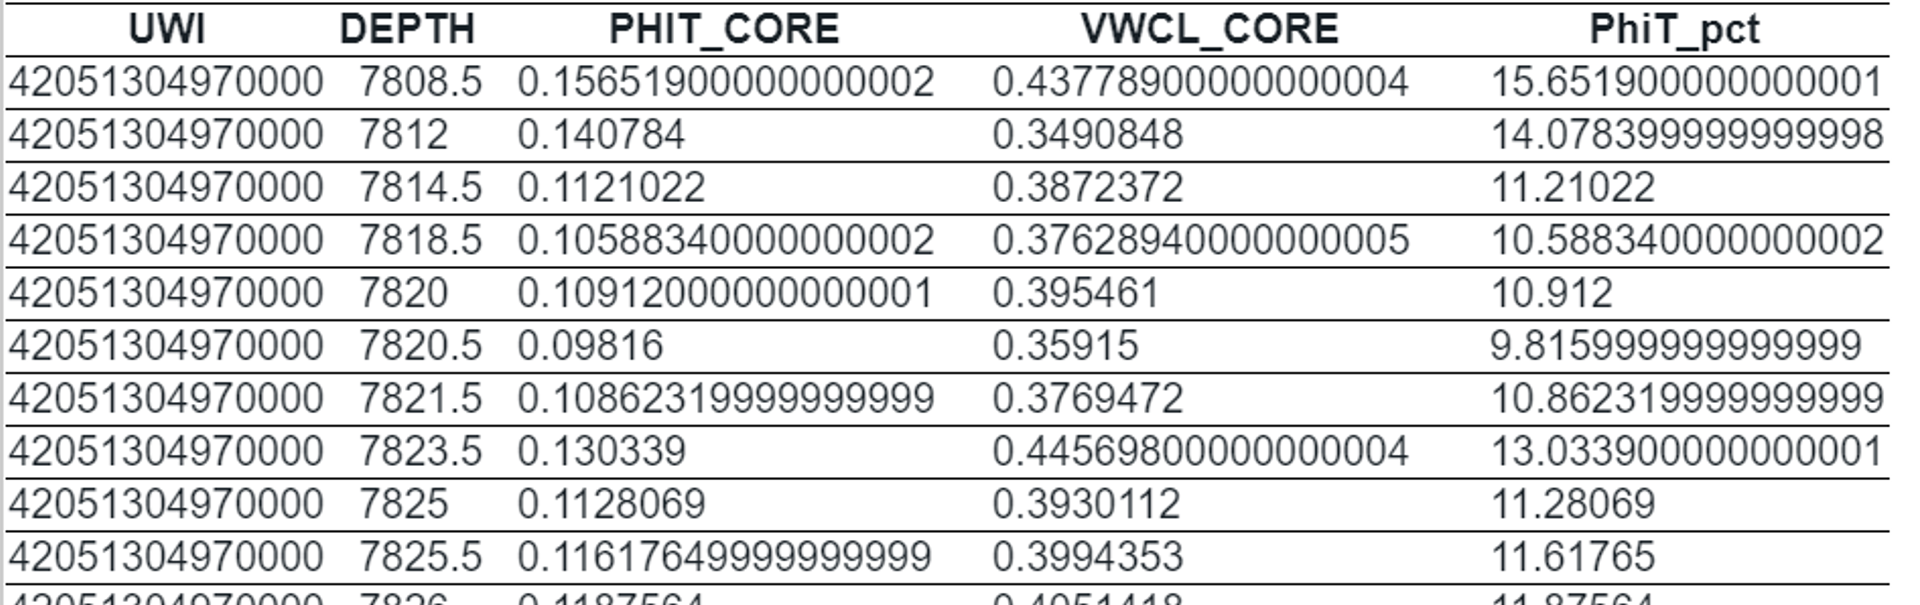
The new column has the exact name we gave it in the PointMath block and it has been multiplied by 100.
Tags
Related Insights
DCA: Type well curves
In this video I demonstrate how to generate a well set filtered by a number of criteria and generate a multi-well type curve. Before starting this video you should already know how to load your data and create a DCA project. If not, please review those videos. Type well curves are generated by creating a decline that represents data from multiple wells.
DCA: Loading Production data
In this video I demonstrate how to load production and well header data for use in a decline curve analysis project. The first step is to gather your data. You’ll need: Production data – this can be in CSV, Excel, or IHS 298 formats. For spreadsheet formats you’ll need columns for API, Date, Oil, Gas, Water (optional), and days of production for that period (optional). Well header data – this can be in CSV, Excel, or IHS 297 formats.
Sample data to get started
Need some sample data to get started? The files below are from data made public by the Wyoming Oil and Gas Commission. These will allow you to get started with petrophysics, mapping, and decline curve analysis. Well header data Formation tops data Deviation survey data Well log data (las files) Production data (csv) or (excel) Wyoming counties shapefile and projection Wyoming townships shapefile and projection Haven’t found the help guide that you are looking for?