Publishing User Python Tools
Danomics Flow blocks let users use Python to write their own tools. These tools can vary from simple scripts to calculate a property to complex tools with several user options. Once the time has been invested to write a Python tool users often want to make this tool widely available to others in their organization. Danomics allows you to do this by publishing the Flow block. This article shows how to do this.
Note: Many of Danomics own published Flow tools are written in Python (e.g., Rename Log Curve, Log Upscaling, etc.).
Publishing a Python Flow Tool
When building flows it is relatively common to use a Python block to process data. In many cases these tools are useful to others in your company and you would like to make it broadly available to them. Let’s consider an example Flow tool that calculates the clay volume from gamma ray, with user options for the clean and clay parameters.
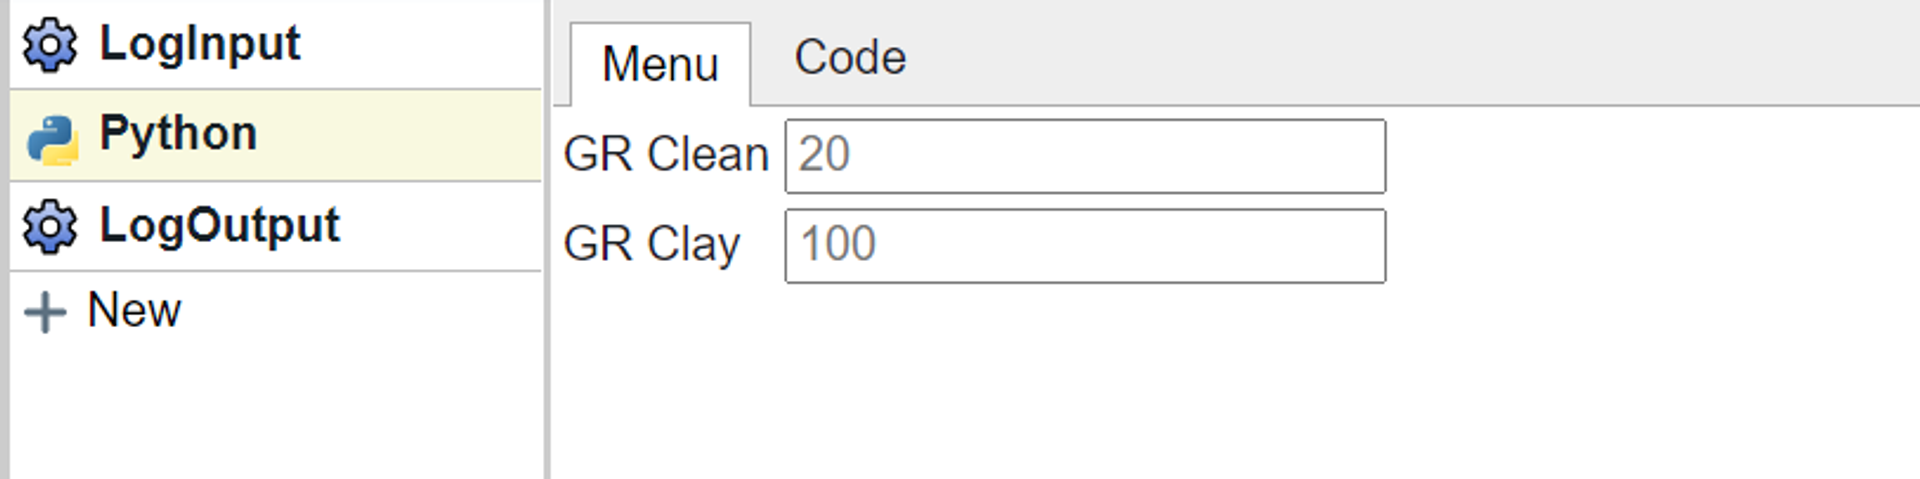
The Python block menu is as follows:
The code that generates this is as follows:
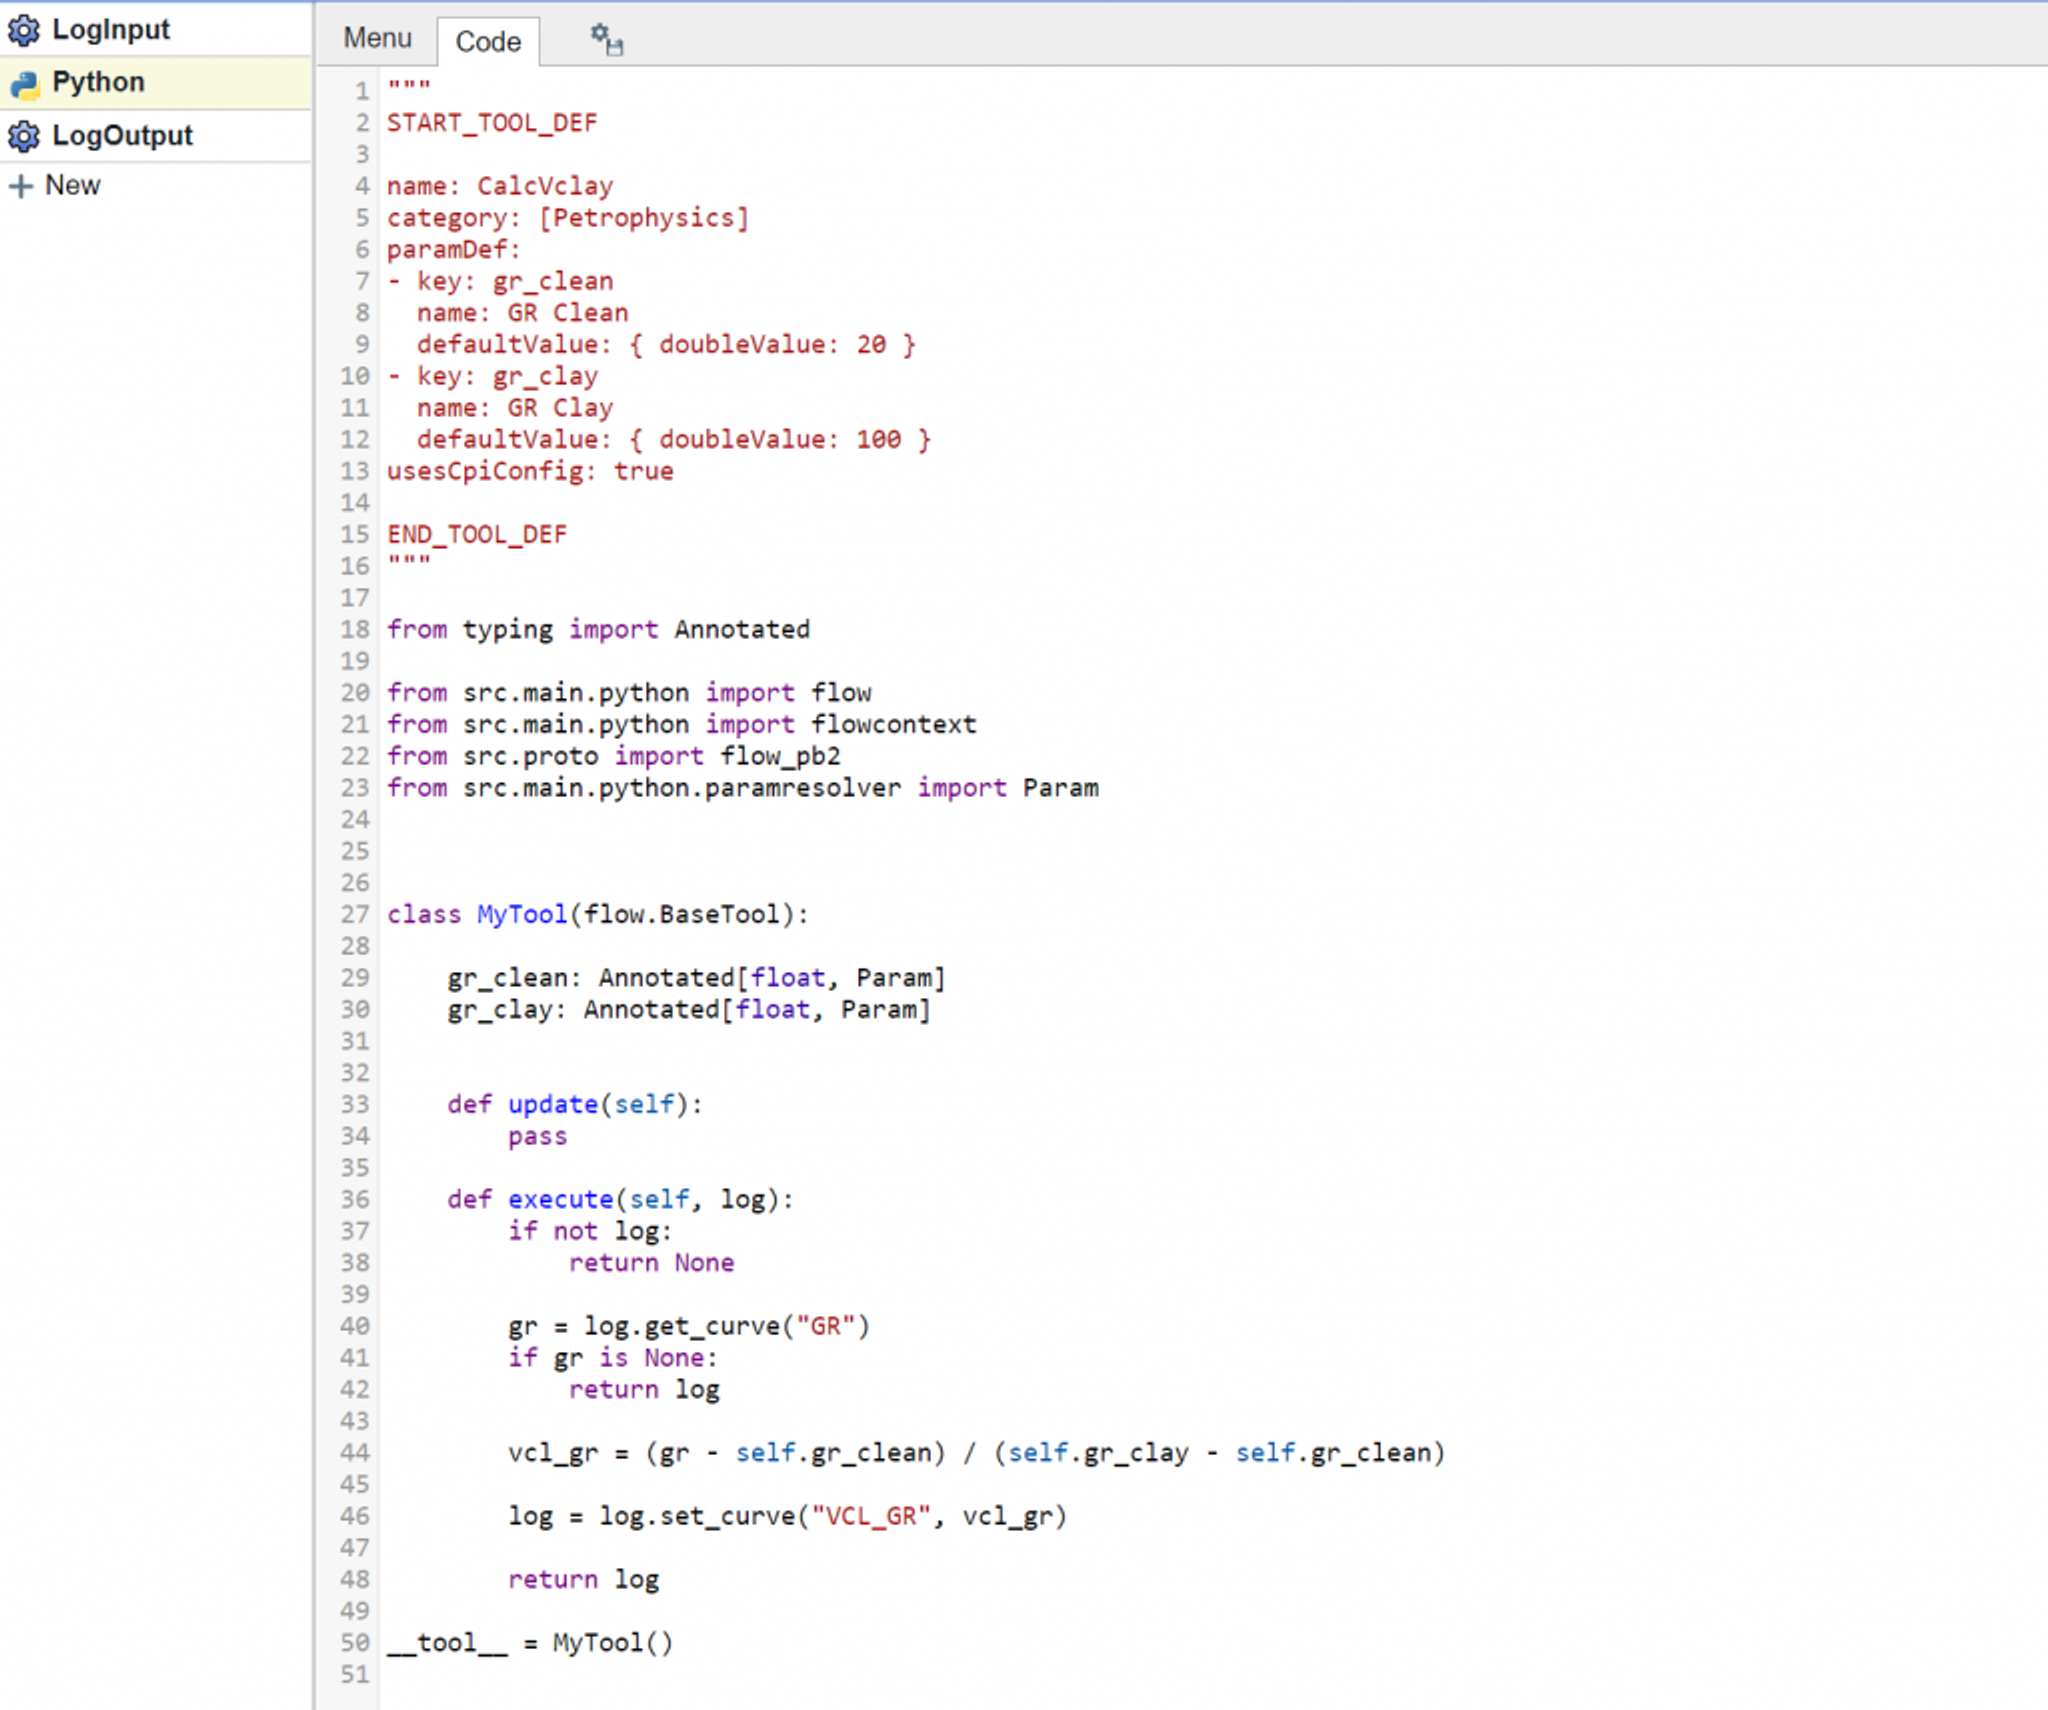
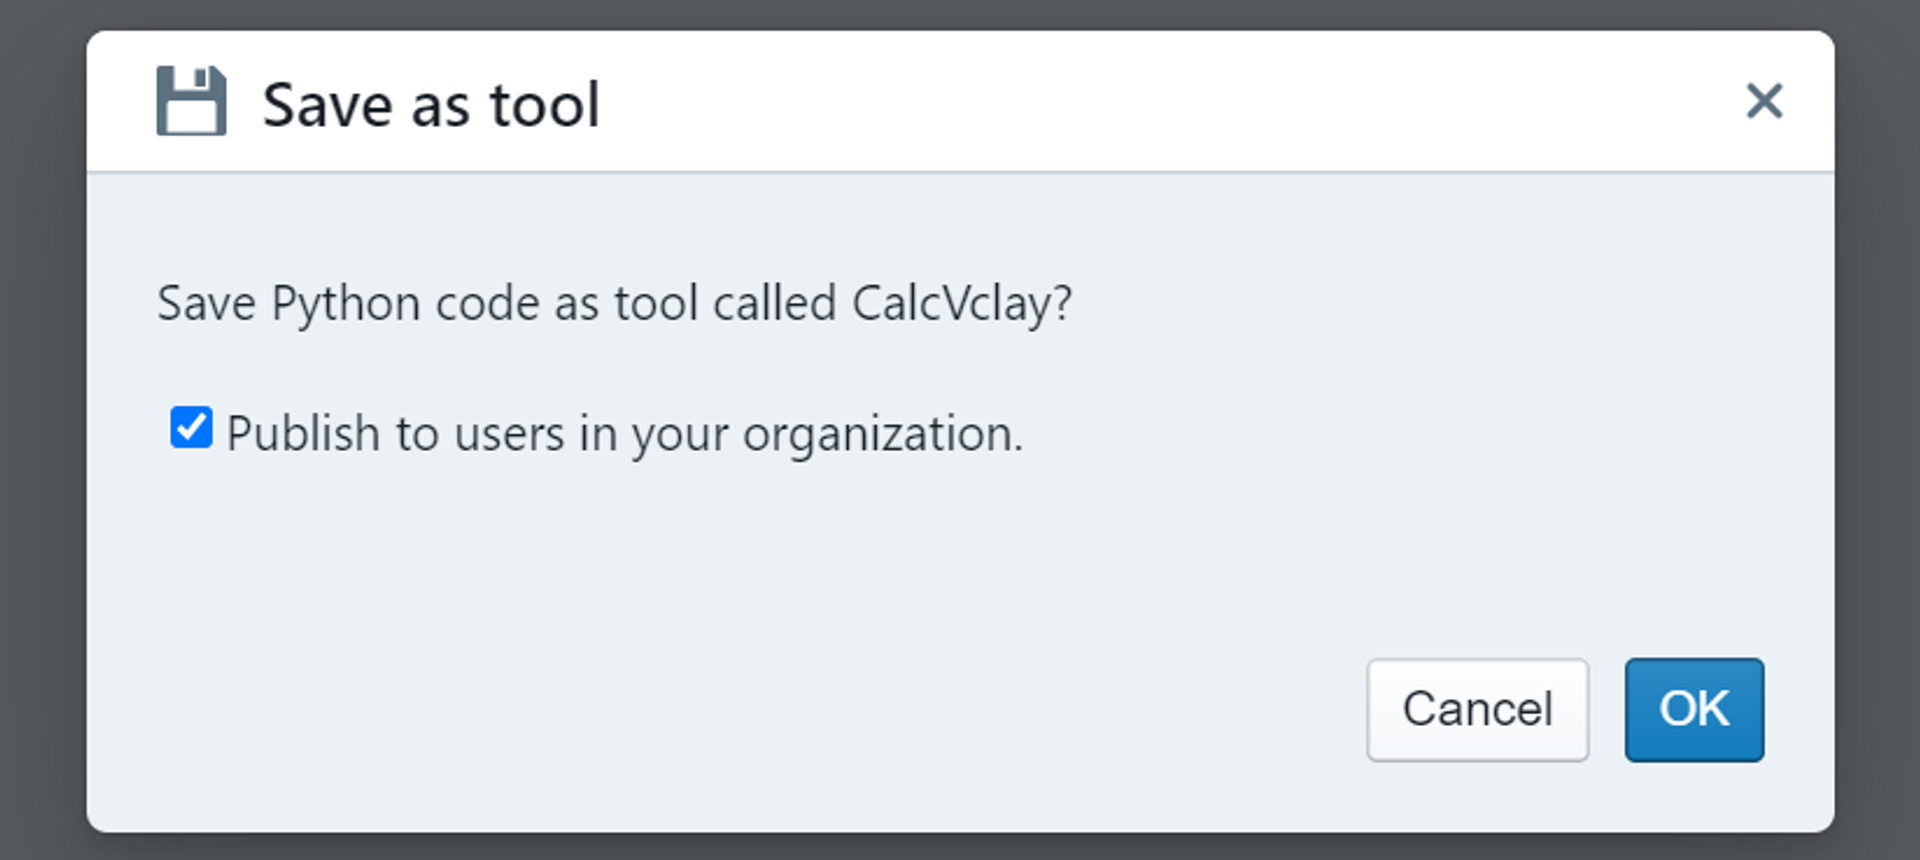
For the purposes of saving the Python tool, the key part is the “name:” field provided in the tool definition. This name should be unique. To share the tool with other users click on the icon to the right of the Code tab. This opens a dialogue to “Save as tool”.
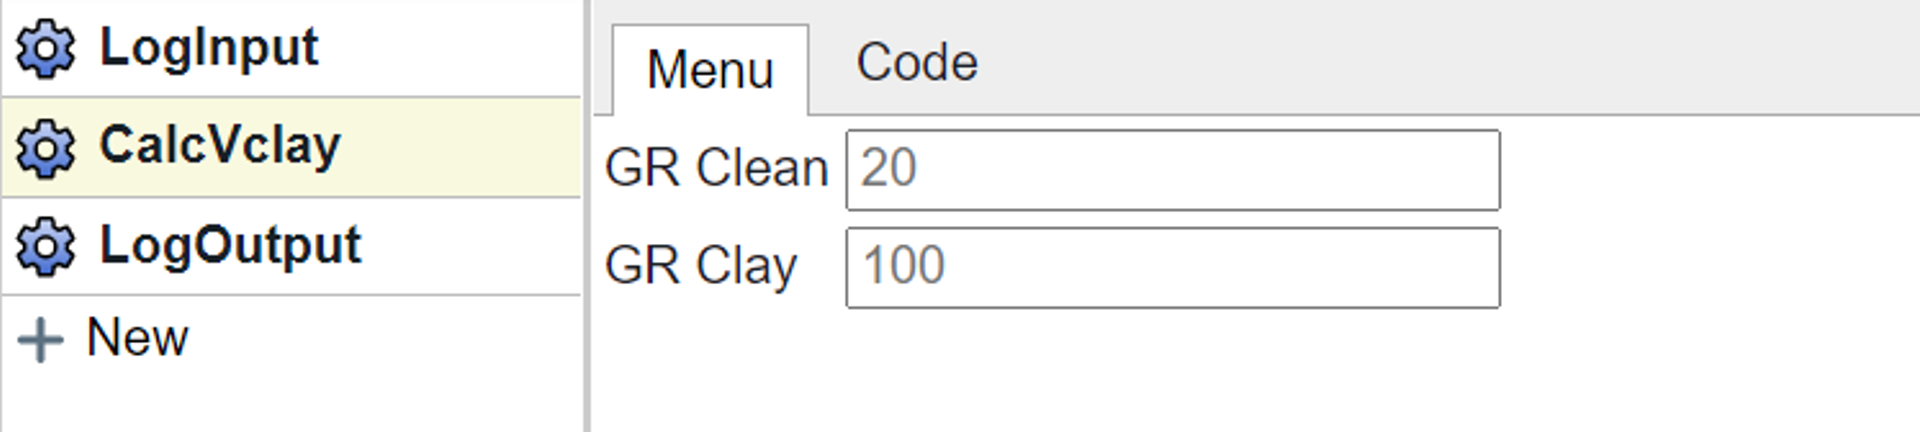
Once the tool has been published it will show up in the Flow tools folder in the File Navigation menu on the left hand side. When added to a flow it will now appear with its name as shown here.
Use Cases
Companies can develop a series of Python tools to process data and execute on workflows. The space for innovation is immense. Some of the early use cases include:
- Processing logs using a fixed series of operations
- Providing access to machine learning models trained by operator data science teams
- Bring proprietary methods into the Danomics platform
The ability to publish tools within an organization enables companies to develop a rich innovation pipeline and utility tools that can accelerate workflows.
Tags
Related Insights
DCA: Type well curves
In this video I demonstrate how to generate a well set filtered by a number of criteria and generate a multi-well type curve. Before starting this video you should already know how to load your data and create a DCA project. If not, please review those videos. Type well curves are generated by creating a decline that represents data from multiple wells.
DCA: Loading Production data
In this video I demonstrate how to load production and well header data for use in a decline curve analysis project. The first step is to gather your data. You’ll need: Production data – this can be in CSV, Excel, or IHS 298 formats. For spreadsheet formats you’ll need columns for API, Date, Oil, Gas, Water (optional), and days of production for that period (optional). Well header data – this can be in CSV, Excel, or IHS 297 formats.
Sample data to get started
Need some sample data to get started? The files below are from data made public by the Wyoming Oil and Gas Commission. These will allow you to get started with petrophysics, mapping, and decline curve analysis. Well header data Formation tops data Deviation survey data Well log data (las files) Production data (csv) or (excel) Wyoming counties shapefile and projection Wyoming townships shapefile and projection Haven’t found the help guide that you are looking for?