Tops Interpolation Flow
When working with large numbers of wells we often don’t have a fully picked stratigraphic framework available. This can cause issues when you are trying to perform calculations using defined zones. There are two options available to the user in this case:
- Pick out the tops manually
- Use automation to fill in the missing tops
Picking the tops manually, even though it is quite easy in Danomics, can still take a substantial amount of time if there are 1000s of wells and several horizons. For projects with short timelines this means we have to use some sort of automated method. In the simplest case we will use structural grids made from existing tops datasets to define tops in wells where they are not currently present. To do this we will use the TopsInterpolation flow.
Considerations
Before starting it is important to understand how this works. The system we will be using does the following:
- Reads in your existing tops
- Generates a structural grid for each top
- Reads in the depth curve from the well log
- Determines if there is an intersection between the wellbore and the structural grid
- Applies the logic that IF a top is already present, keep original, IF NOT present and wellbore and grid intersect, add new top. If wellbore and grid do not intersect, skip.
This means that once you run it, every well should have the tops that would be present in the well if manually picked. Note, the accuracy of this depends on the quality of the initially picked tops and the subsequently generated grids. It is important to QC preliminary grids (just make a structure map in the petrophysics file) to ensure that they look reasonable.
Tops Interpolation Flow
We accomplish the tops infilling via a flow as shown below:
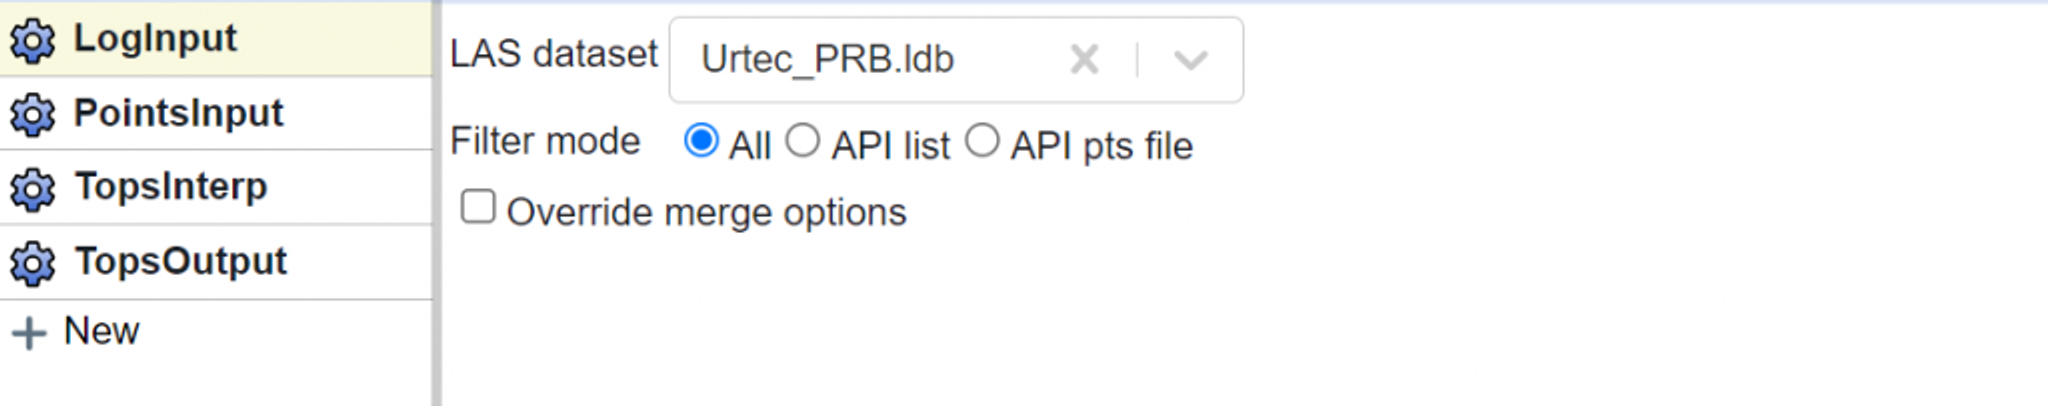
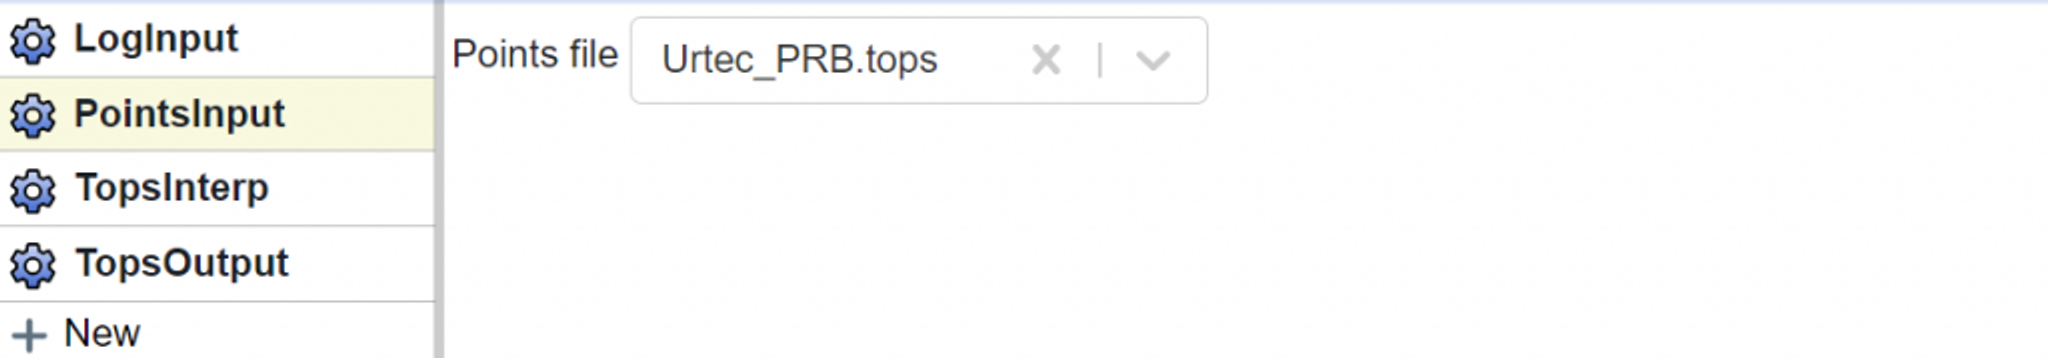
Start, by selecting your relevant log database in the LogInput block. Next, in the PointsInput block select your tops database.
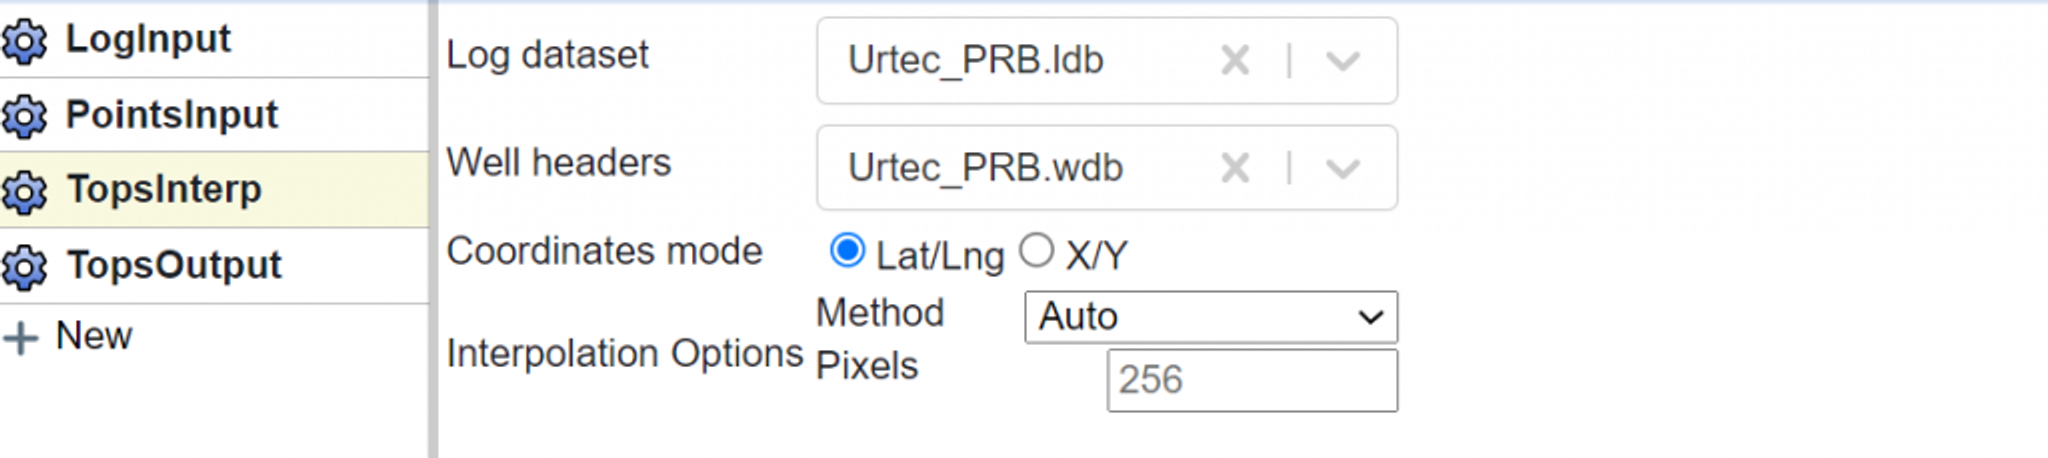
In the TopsInterp block you will need to set the log dataset and the well headers database that covers the wells of interest.
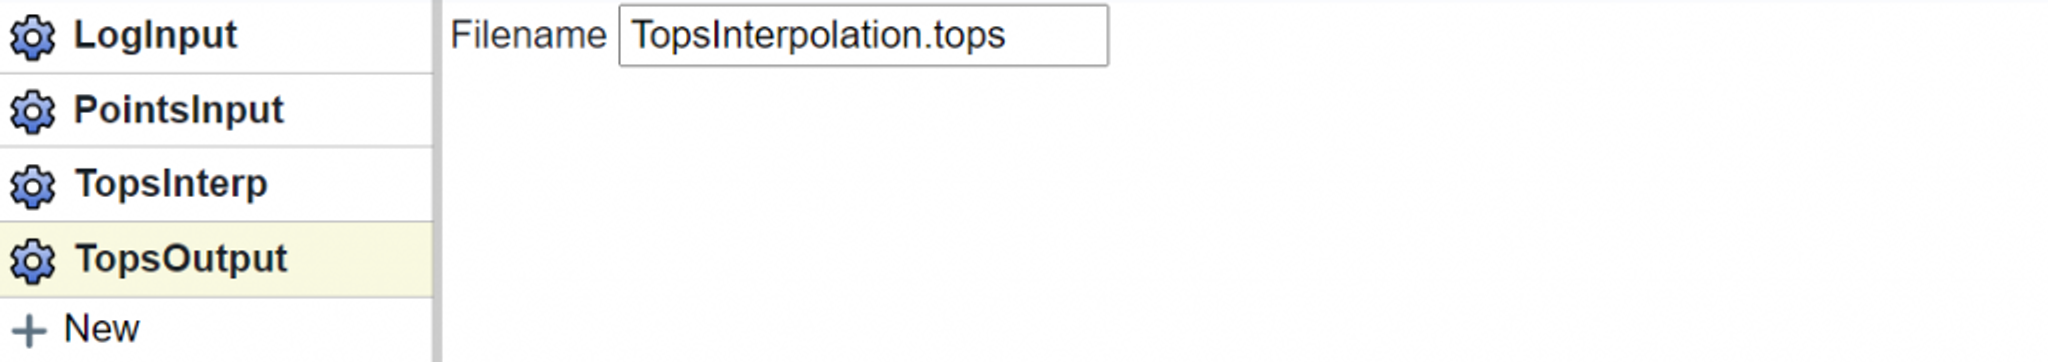
And finally, in the TopsOutput block you will need to provide a name for the resulting tops dataset.
Once you have ran this, you can then use the Interpolated Tops in your petrophysics projects!
Tags
Related Insights
DCA: Type well curves
In this video I demonstrate how to generate a well set filtered by a number of criteria and generate a multi-well type curve. Before starting this video you should already know how to load your data and create a DCA project. If not, please review those videos. Type well curves are generated by creating a decline that represents data from multiple wells.
DCA: Loading Production data
In this video I demonstrate how to load production and well header data for use in a decline curve analysis project. The first step is to gather your data. You’ll need: Production data – this can be in CSV, Excel, or IHS 298 formats. For spreadsheet formats you’ll need columns for API, Date, Oil, Gas, Water (optional), and days of production for that period (optional). Well header data – this can be in CSV, Excel, or IHS 297 formats.
Sample data to get started
Need some sample data to get started? The files below are from data made public by the Wyoming Oil and Gas Commission. These will allow you to get started with petrophysics, mapping, and decline curve analysis. Well header data Formation tops data Deviation survey data Well log data (las files) Production data (csv) or (excel) Wyoming counties shapefile and projection Wyoming townships shapefile and projection Haven’t found the help guide that you are looking for?