Geomechanics
Note: This module originally included many pore pressure options. These have been moved to the Pore Pressure module, while wellbore stability calculations have been moved to the 1D Geomechanical Earth Model module.
In Danomics Petrophysics Insights users are guided through a workflow that walks them through a number of modules. These modules are located via a dropdown menu at the top center of the window. The modules are listed in the order in which a user should ideally proceed through a project. However, this order is not strictly enforced and the user can start at any module and can seamlessly move both forward and back through the modules. This help article will focus on the Geomechanics module.
Geomechanics
Note – it is highly recommended that you run the shear log modelling module before evaluating the geomechanics if your well does not have a shear log available, as some calibration will be required.
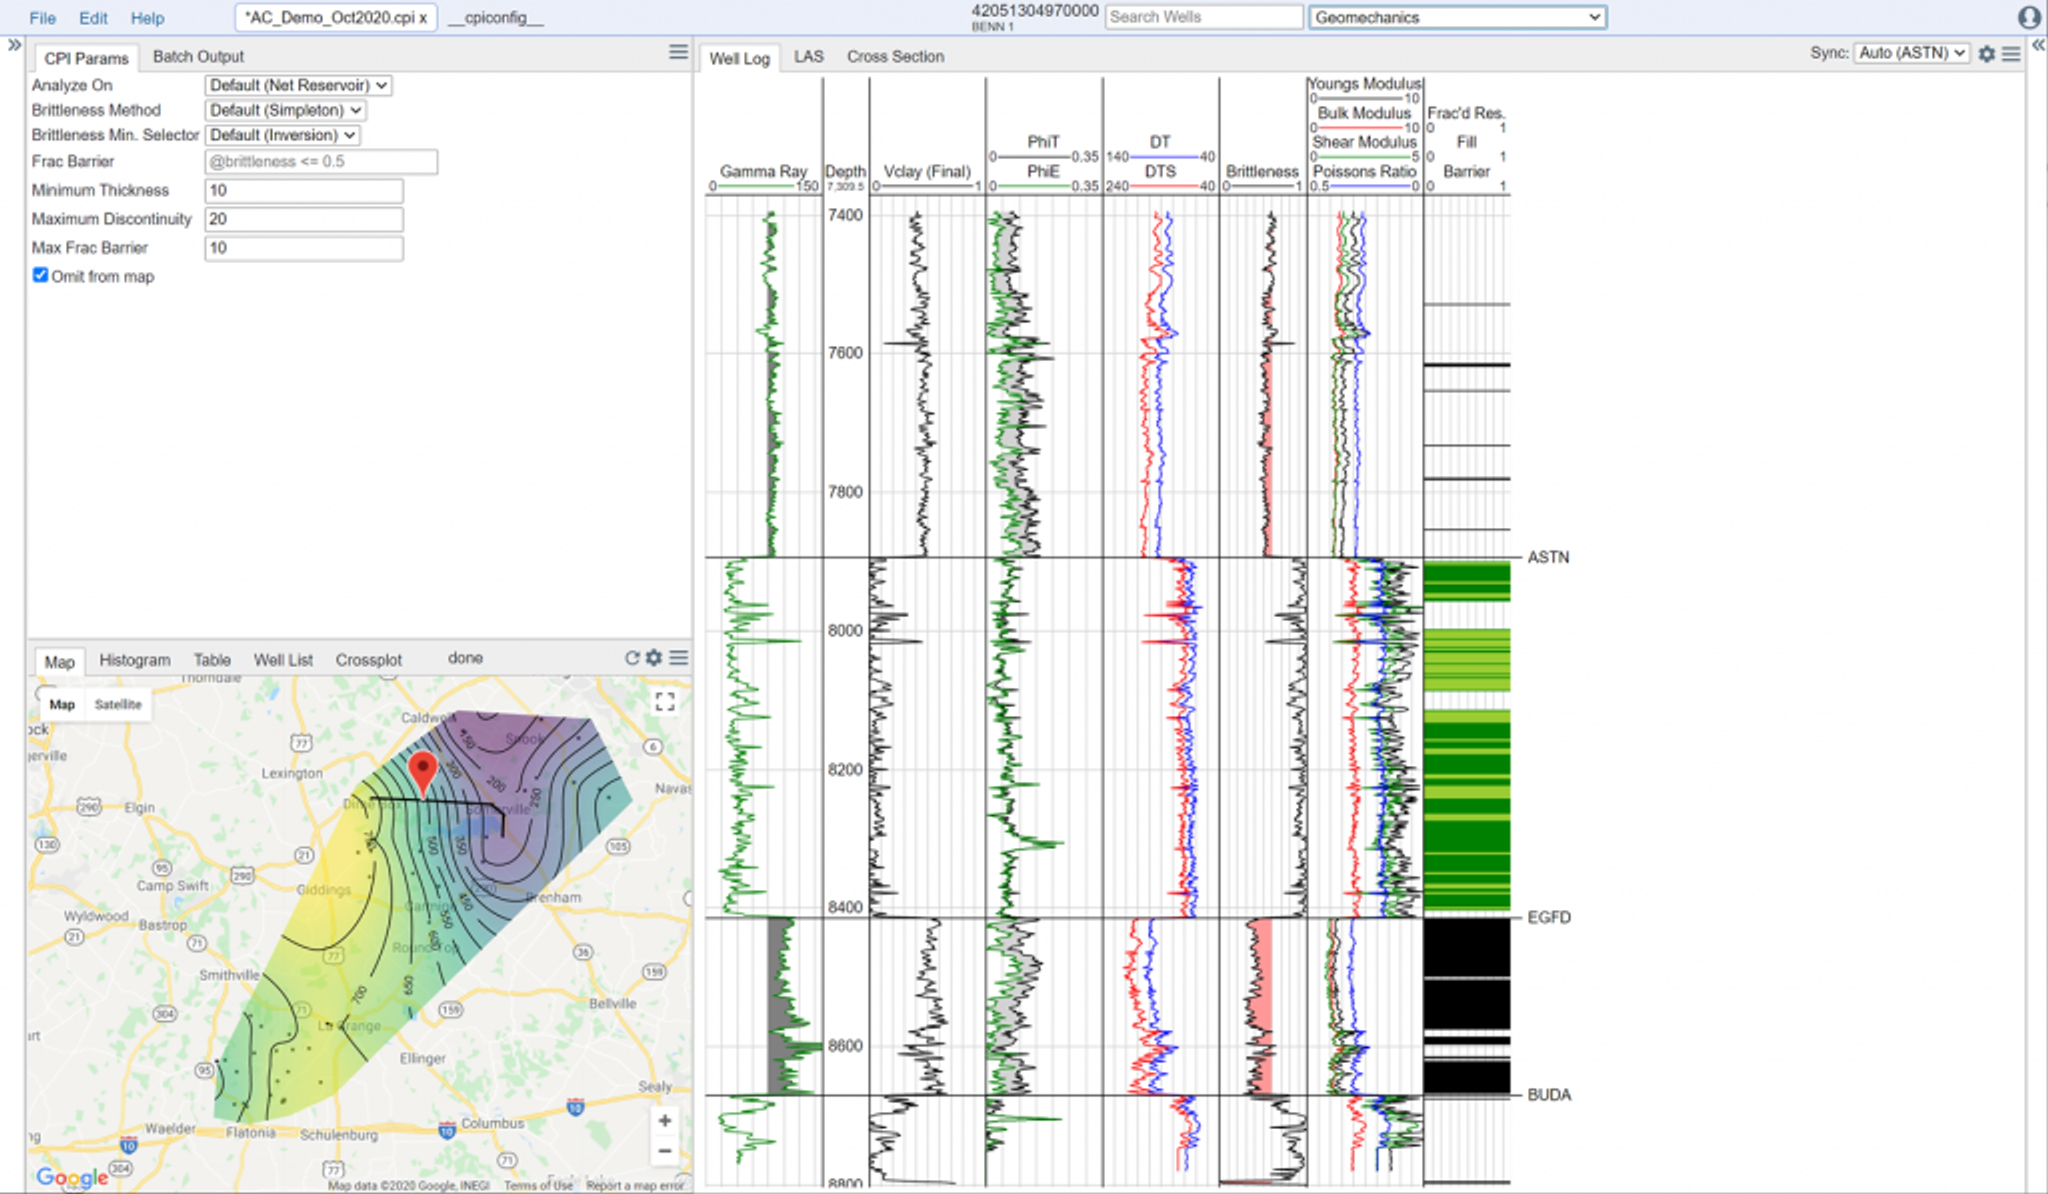
This module is primarily intended to display the key moduli, Poisson’s ratio, and to help the user visualize reservoir continuity as a function of brittleness. The parameters available to the user include:
- Analyze On: Choose if you wish to evaluate gross reservoir, net reservoir, or net pay.
- Brittleness Method: Choose the Simpleton (Danomics), Jarvie et al., or Wang and Gale methods.
- Brittleness Min Selector: Choose if you wish to use the mineralogy from the inversion or from the RhoMaa-UMaa crossplot. This is required for the Jarvie et al., and Wang and Gale methods. If using the RhoMaa-UMaa crossplot, this requires a PE curve to be available.
- Frac Barrier: Define a frac barrier using the syntax outlined in the CPI Config help.
- Minimum Thickness: This parameter establishes the minimum thickness of reservoir analyzed on to be considered for continuity analysis.
- Maximum Discontinuity: This parameter establishes the maximum thickness of non-reservoir to be included for continuity analysis.
- Max Frac Barrier: This parameter establishes how much interval meeting the definition of a frac barrier can be included for continuity analysis.
The Continuity Analysis is designed to help the user visualize what packages may be connected for the purposes of drilling and completing a horizontal well. Note, this is a quicklook method and is not based on a numerical simulation.
Key Outputs
CurveDescriptionshear_modulusCalculated Shear Modulusbulk_modulusCalculated Bulk Modulusyoungs_modulusCalculated Youngs Moduluspoissons_ratioCalculated Poissons RatiobrittlenessCalculated Brittlenessfrac_packageA flag indicating if a portion of the interval has met the quicklook criteria for inclusion in a continuous interval.
Tags
Related Insights
DCA: Type well curves
In this video I demonstrate how to generate a well set filtered by a number of criteria and generate a multi-well type curve. Before starting this video you should already know how to load your data and create a DCA project. If not, please review those videos. Type well curves are generated by creating a decline that represents data from multiple wells.
DCA: Loading Production data
In this video I demonstrate how to load production and well header data for use in a decline curve analysis project. The first step is to gather your data. You’ll need: Production data – this can be in CSV, Excel, or IHS 298 formats. For spreadsheet formats you’ll need columns for API, Date, Oil, Gas, Water (optional), and days of production for that period (optional). Well header data – this can be in CSV, Excel, or IHS 297 formats.
Sample data to get started
Need some sample data to get started? The files below are from data made public by the Wyoming Oil and Gas Commission. These will allow you to get started with petrophysics, mapping, and decline curve analysis. Well header data Formation tops data Deviation survey data Well log data (las files) Production data (csv) or (excel) Wyoming counties shapefile and projection Wyoming townships shapefile and projection Haven’t found the help guide that you are looking for?