Petrophysics Plugins API
The Danomics’ Petrophysics Insights Plugins API makes it easy to use your proprietary petrophysical code inside Danomics.
When to use the Plugins API
Use the Plugins API when you want to run and deploy your custom code. For example, you could deploy ML algorithms based on TensorFlow using the Plugins API.
The Plugins API is not the right tool for all tasks. Deterministic petrophysical workflows are typically based on sample-by-sample or simple vector equations that can be handled more simply with the CPI Config. For small interactive tasks, we recommend the Equation Playground and Python Playground modules.
Don’t call us, we’ll call you
Your code runs in a web service owned and controlled by you. Danomics sends you data to process and then displays the results.
We recommend getting started using Google Cloud Functions with Python. That said, you can write the web service in any language, and it can run in any datacenter or cloud.
No database required
Danomics will send a JSON request with log data, tops, and parameters to your web service. Your job is to compute and return one or more curves.
Security is built in
To keep your data secure, requests need to be authenticated in both directions. Danomics verifies the identity of your server by checking the https certificate. Your server verifies that the request originates from Danomics by checking a signature signed with a private key known only to Danomics.
Quickstart
Before you begin
1.Sign in to your Google Cloud account. If you don’t already have one, sign up for a new account.
2. Go to cloud.google.com.
3. Select or create a Google Cloud Platform project.
4. Enable the Cloud Functions API. Note, if you have not previously set up billing you will be asked to do so. Although a substantial work can be done under the free tier charges may be incurred.
Create a function
1. Open the Functions Overview page in the GCP Console.
2. Make sure that the project for which you enabled Cloud Functions is selected.
3. Click Create function.
4. Name your function my-python-plugin.
5. In the Trigger field, select HTTP Trigger.
6. Use the Runtime dropdown to select a Python 3.7 runtime.
7. In the Source code field, select Inline editor. Paste in the following source code into main.py:
from danomics.api import petrophysics
from flask import Response
import json
import numpy as np
def process_log(request):
"""Responds to a request for a clay volume computation.
Args:
request (flask.Request): HTTP request with data, aliases, and params, etc.
Returns:
json result
"""
# Verify that the request was received from Danomics
# Passing environment is only required for use with Danomics’ staging environment
# You can also optionally verify the requestor email.
message = request.get_data()
signature = request.headers.get("X-Danomics-Signature")
environment = request.get_json()["environment"]
petrophysics.verify_request_authenticity(message, signature, environment)
reqjs = request.get_json()
gr = np.array(petrophysics.get_curve(reqjs, "gr"))
gr_clean = petrophysics.get_param(reqjs, "gr_clean")
gr_clay = petrophysics.get_param(reqjs, "gr_clay")
vcl_plugin = (gr - gr_clean) / (gr_clay - gr_clean)
out = petrophysics.serialize_results({ "vcl_plugin": vcl_plugin })
js = json.dumps(out)
return Response(js, status=200, mimetype='application/json')
This code computes output curves based on one input LAS. The input data, aliases, parameters, etc. are contained in the request. The code first verifies that the request was sent by Danomics. It then computes and returns the result.
Modify Requirements.txt
8. Add the following lines to requirements.txt:
https://storage.googleapis.com/danomics-static/danomics-0.0.6.tar.gz
The plugin uses a utility library from Danomics to handle multiple common tasks such as serialization and authentication.
9. When you finish these steps, your display should resemble the following:
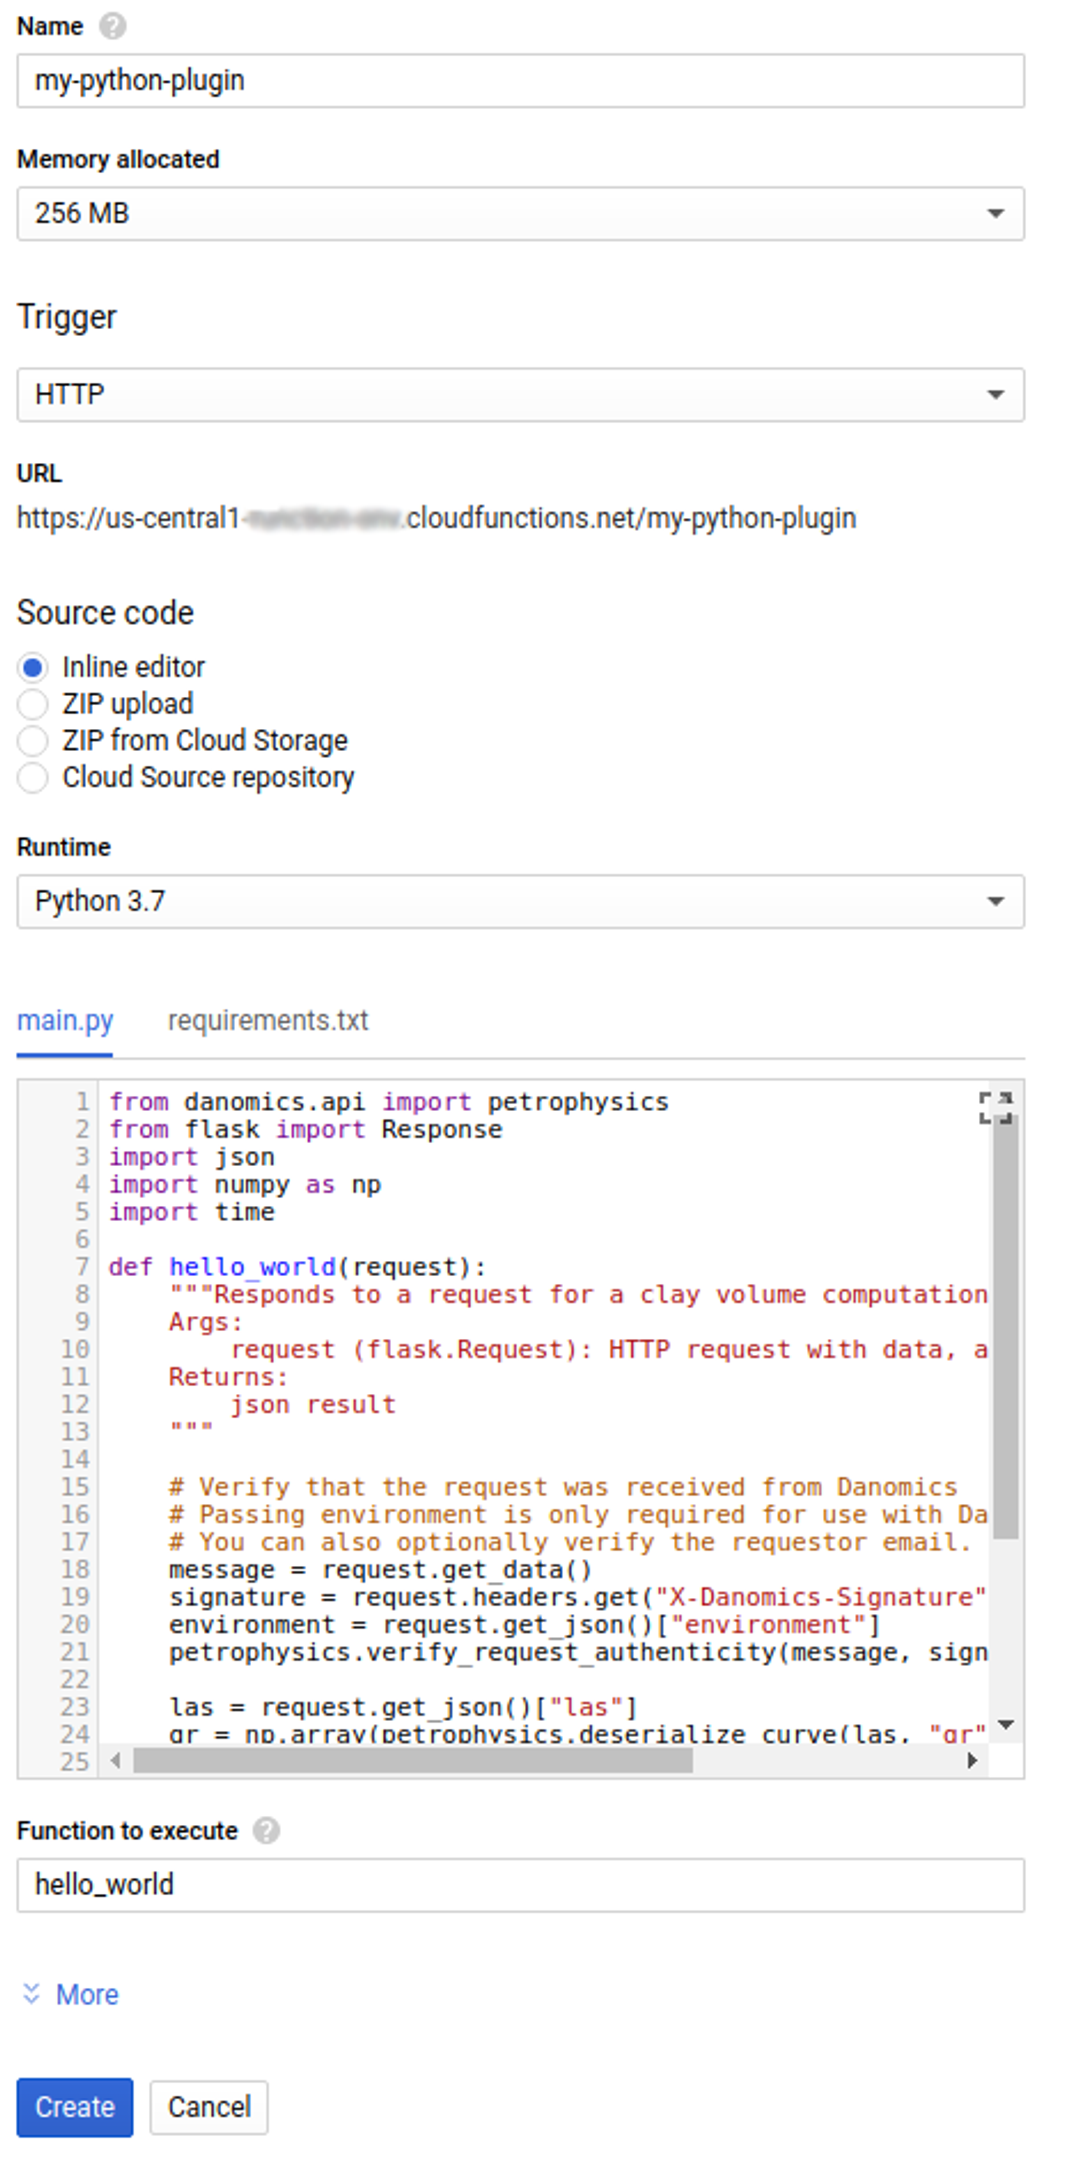
10. Copy the URL of your function. You will later configure Danomics to use that URL.
Deploy the function
1. At the bottom of the page, click Create.
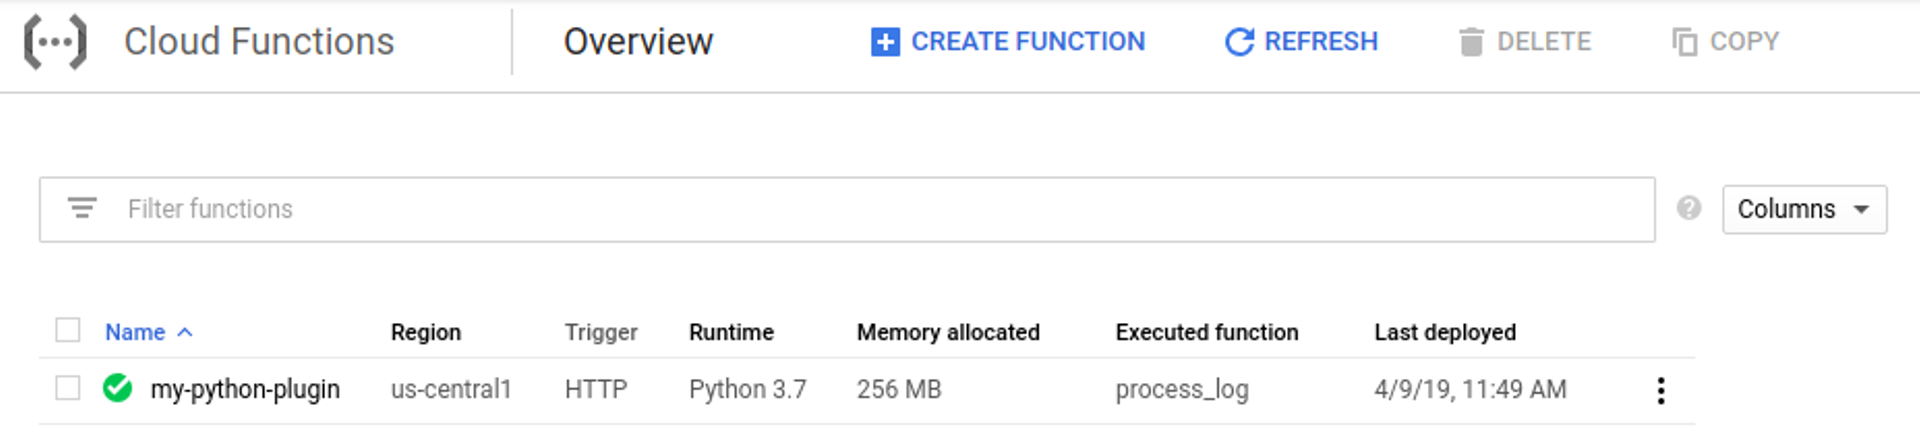
2. After clicking Create, GCP Console redirects to the Cloud Functions Overview page.
While the function is being deployed, the icon next to it is a small spinner. After it finishes deploying, the spinner turns to a green check mark:
Configure Danomics
1. In Danomics, open the Cpi Config
2. Add the following entries to the Equation section:
equation:
...
- key: vcl_plugin
units: .dec
description: GR Clay Volume
pluginServerKey: my-python-plugin
pluginParam: [ gr_clay, gr_clean ]
- key: ...
3. Add a new pluginServer section:
pluginServer:
- key: my-python-plugin
url: https://us-central1-<your project name>.cloudfunctions.net/my-python-plugin
Use the URL you copied from Google Cloud above.
4. Add the equation to the Clay Volume plot
plot:
...
- key: vclay
name: Clay Volume
track:
...
- type: LOG_GRAPH
width: 150
computedCurve:
- { key: vcl_gr, name: "Vclay (GR)", xmin: 0, xmax: 1, stroke: green }
- { key: vcl_plugin, name: "Vclay (Plugin)", xmin: 0, xmax: 1, stroke: orange }
...
5. Click Submit To Server and refresh the page.
Testing and Troubleshooting
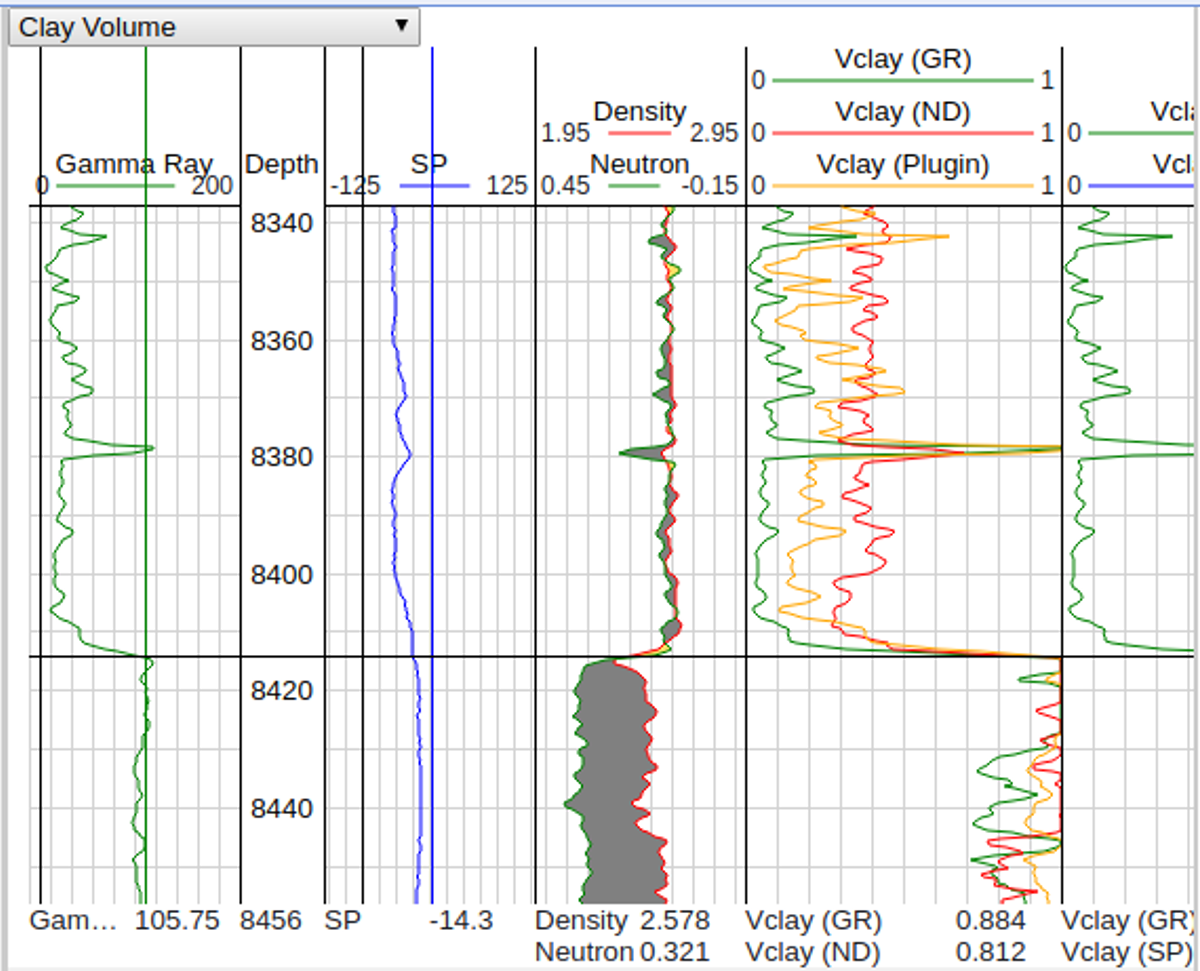
1. Open up a cpi file in Danomics, select a well, and show the Clay Volume module. Your vcl_plugin curve should show up in the Clay Volume module
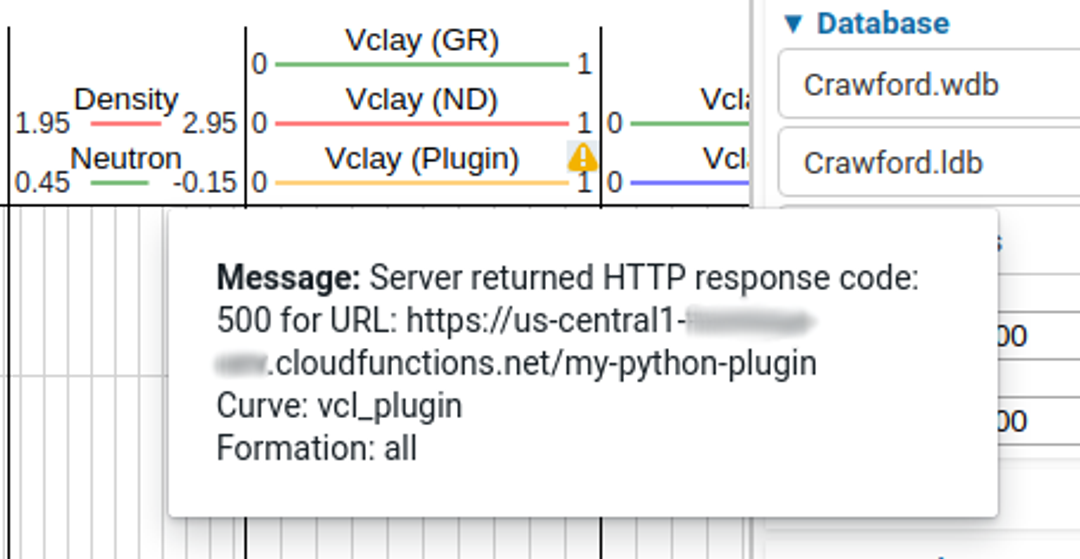
2. If your function returns an error, for example a 500 response code, Danomics will show a warning icon next your curve. Click on it to see the error message:
3. If your Python code threw an exception, it will be visible from the Cloud Functions log.
3a. Go to Cloud Functions on Google Cloud Console
3b. Select View Logs for your function and see whether any logs have errors.
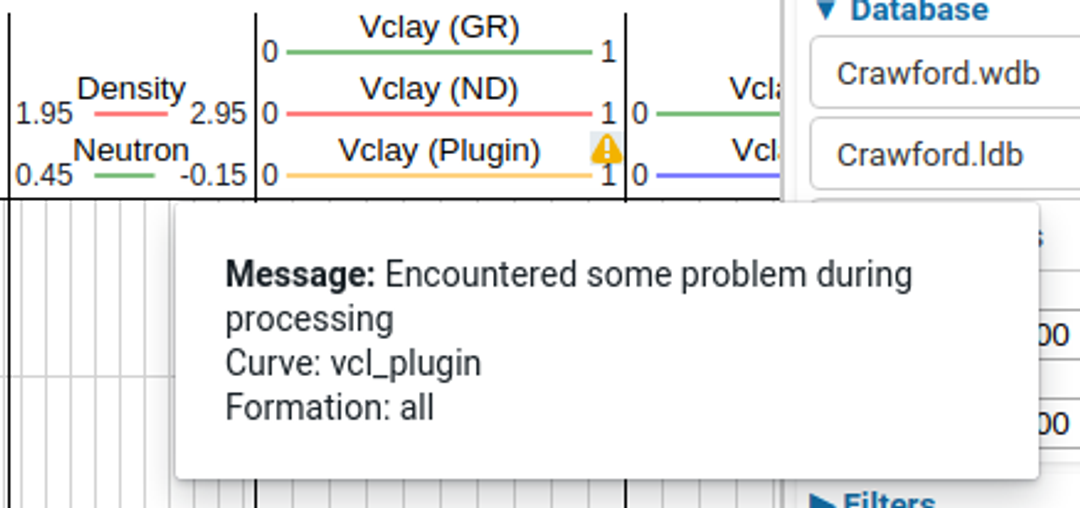
4. If your code encounters a problem during processing, best practice is to intentionally report an error back to the server. Errors can be passed to the serialize_results function:
...
out = petrophysics.serialize_results(
curves={},
errors=["Encountered some problem during processing"])
...
Danomics will display this as an error associated with the curves processed by that plugin:
Tags
Related Insights
DCA: Type well curves
In this video I demonstrate how to generate a well set filtered by a number of criteria and generate a multi-well type curve. Before starting this video you should already know how to load your data and create a DCA project. If not, please review those videos. Type well curves are generated by creating a decline that represents data from multiple wells.
DCA: Loading Production data
In this video I demonstrate how to load production and well header data for use in a decline curve analysis project. The first step is to gather your data. You’ll need: Production data – this can be in CSV, Excel, or IHS 298 formats. For spreadsheet formats you’ll need columns for API, Date, Oil, Gas, Water (optional), and days of production for that period (optional). Well header data – this can be in CSV, Excel, or IHS 297 formats.
Sample data to get started
Need some sample data to get started? The files below are from data made public by the Wyoming Oil and Gas Commission. These will allow you to get started with petrophysics, mapping, and decline curve analysis. Well header data Formation tops data Deviation survey data Well log data (las files) Production data (csv) or (excel) Wyoming counties shapefile and projection Wyoming townships shapefile and projection Haven’t found the help guide that you are looking for?