Customizing Danomics
Danomics lets you customize equations and displays and incorporate your own code. There are four customization options:
CPI Config
Use the CPI Config to customize both equations and displays. The majority of Danomics modules are built using this config. It offers a rich set of sample-by-sample, array-based, and statistical equation options. It lets you define parameters including how they are displayed, conditional visibility, and key-well-based parameter remapping. It lets you define displays, cross-sections, and crossplots. It also includes options for defining curve aliases and export options.
Plugins API
The Plugins API lets you incorporate your own custom code in any language and running on any platform. For example, the Plugins API could be used to deploy code using TensorFlow.
Equation Playground
The Equation Playground is a simple module for interactively prototyping equations. See below for further details.
Python Playground
The Python Playground is a simple module for interactively prototyping equations in Python. See below for further details.
Equation Playground
The equation playground allows users to type in equations and display the results in a log panel. This is useful for quickly prototyping new equations before incorporating them into a config.
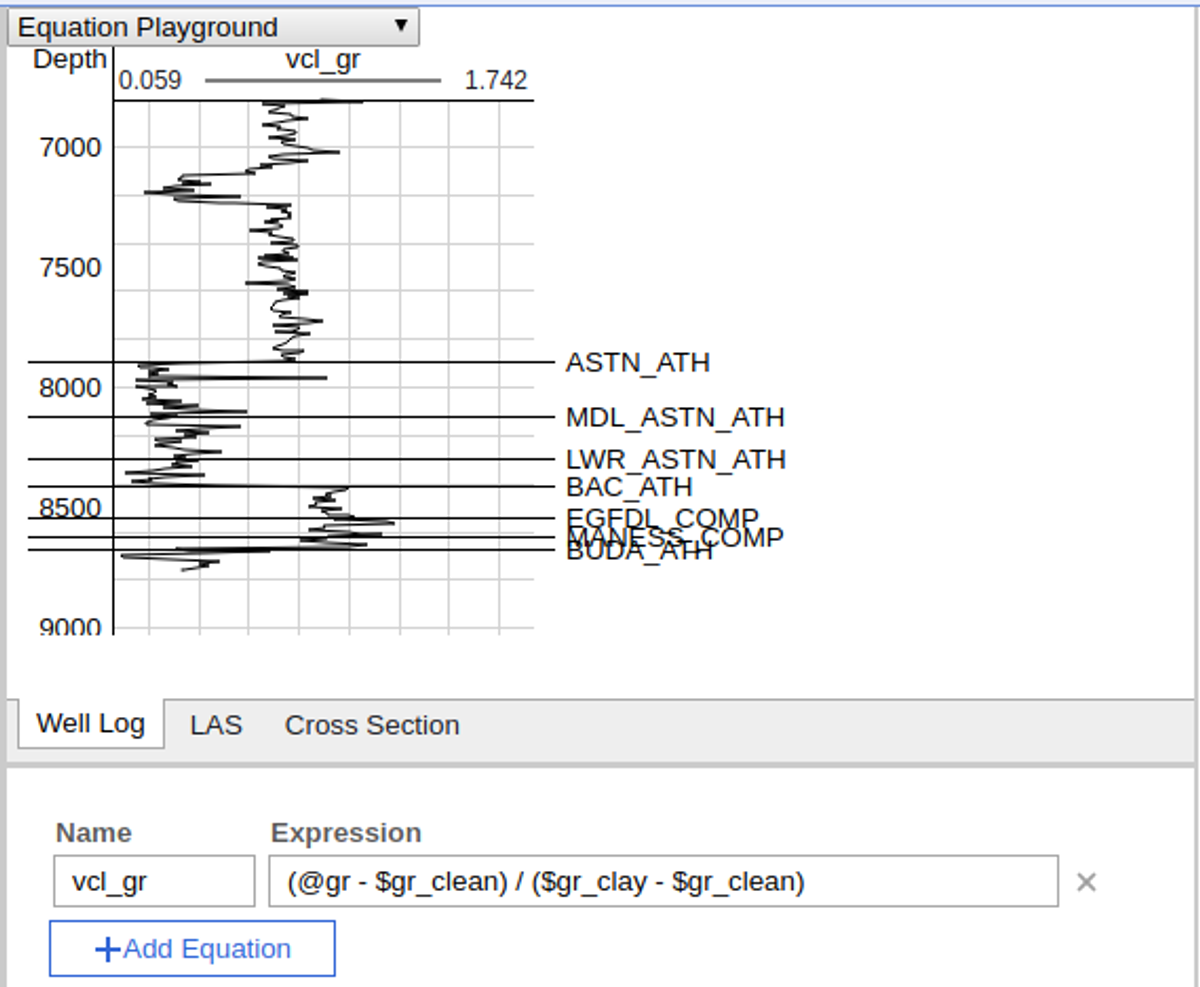
The equation format is the same as for CPI configs. Variables can optionally be prefixed with $ to indicate a parameter or @ to indicate a curve. The expressions are evaluated on vectors similarly to numpy or Matlab and include functionality for statistical and other vector-based functions, and they can invoke other equations.
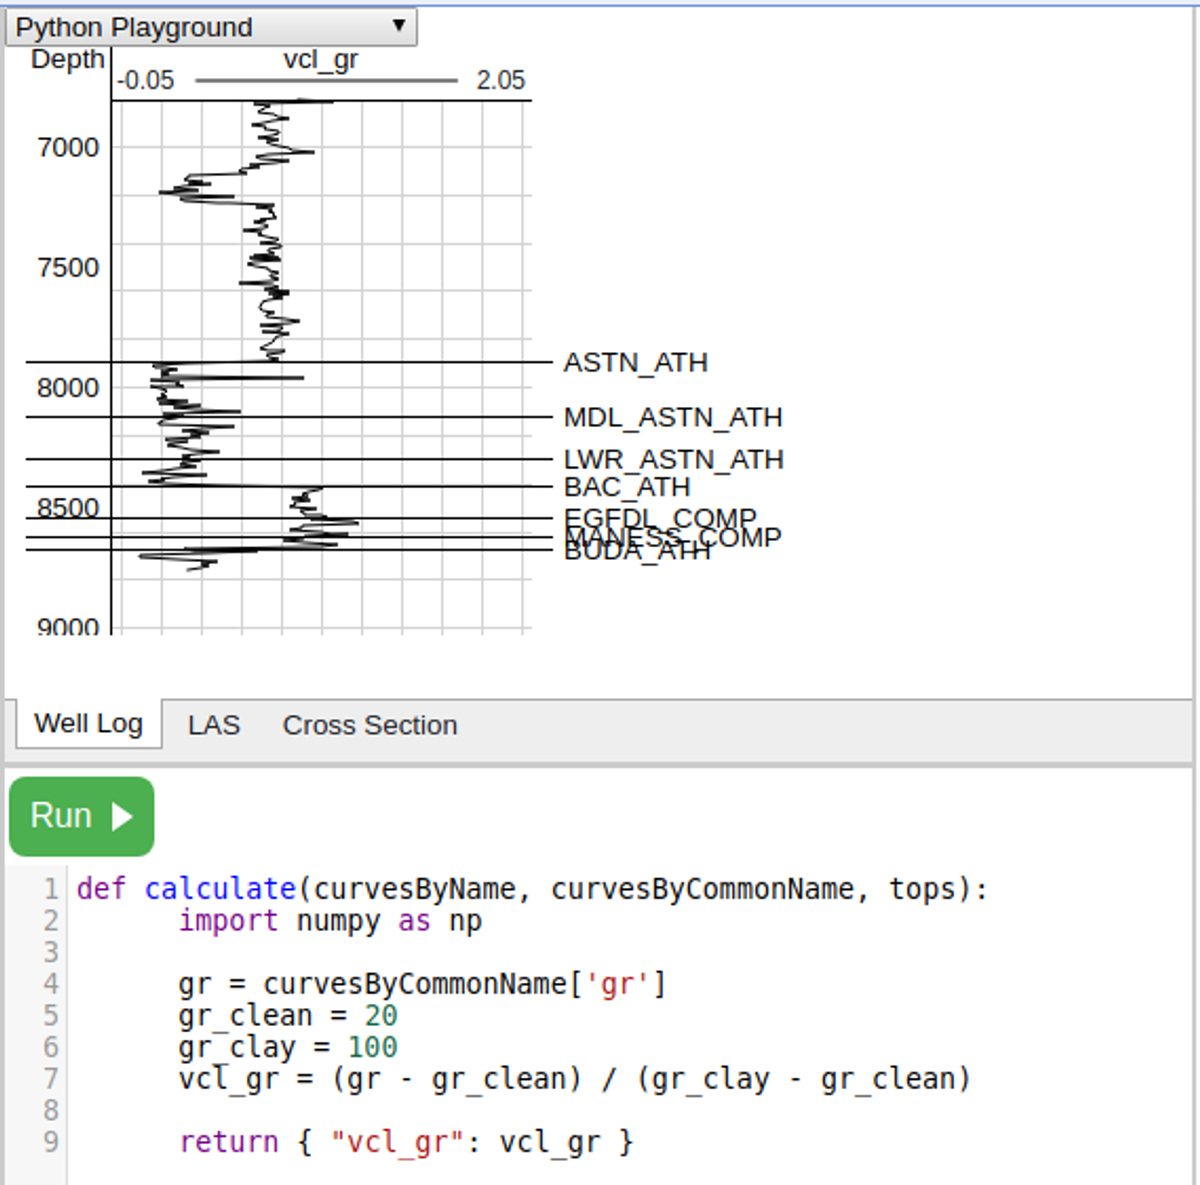
Python Playground
The Python playground allows users to prototype Python code without setting up their own web service. Users type Python directly into the browser. Note that the code runs in a sandbox with limited availability of functions and libraries. See the Petrophysics Plugins API for a more comprehensive option.
Warning: The Python Playground runs in a shared sandbox. Danomics has taken multiple precautions to isolate users within the sandbox, but we cannot guarantee absolute isolation. We do not recommend using the Python Playground for sensitive data. Note that the Python Playground itself is completely isolated from the rest of Danomics, so the risk only pertains to data processed within the Python Playground.
Warning: The Python Playground uses an older API than the Plugins API. We anticipate updating the Python Playground in the future. Your existing Python Playground code may break after those changes.
Tags
Related Insights
DCA: Type well curves
In this video I demonstrate how to generate a well set filtered by a number of criteria and generate a multi-well type curve. Before starting this video you should already know how to load your data and create a DCA project. If not, please review those videos. Type well curves are generated by creating a decline that represents data from multiple wells.
DCA: Loading Production data
In this video I demonstrate how to load production and well header data for use in a decline curve analysis project. The first step is to gather your data. You’ll need: Production data – this can be in CSV, Excel, or IHS 298 formats. For spreadsheet formats you’ll need columns for API, Date, Oil, Gas, Water (optional), and days of production for that period (optional). Well header data – this can be in CSV, Excel, or IHS 297 formats.
Sample data to get started
Need some sample data to get started? The files below are from data made public by the Wyoming Oil and Gas Commission. These will allow you to get started with petrophysics, mapping, and decline curve analysis. Well header data Formation tops data Deviation survey data Well log data (las files) Production data (csv) or (excel) Wyoming counties shapefile and projection Wyoming townships shapefile and projection Haven’t found the help guide that you are looking for?