Key Wells & Parameters
You have now registered, uploaded your data, decided on your calculation ranges and setup, and are ready to select and interpret your key well.
Selecting a Key Well
Within Danomics Petrophysics Insights the software operates on a key well basis. The key well is essentially used as a blue print for all non-key wells in a project. Your key well should ideally be:
- Representative of your data set with respect its data distributions and rock types
- Have most or all of the zones/formations of interest present
- Have a complete suite of log curves
- Have good data quality
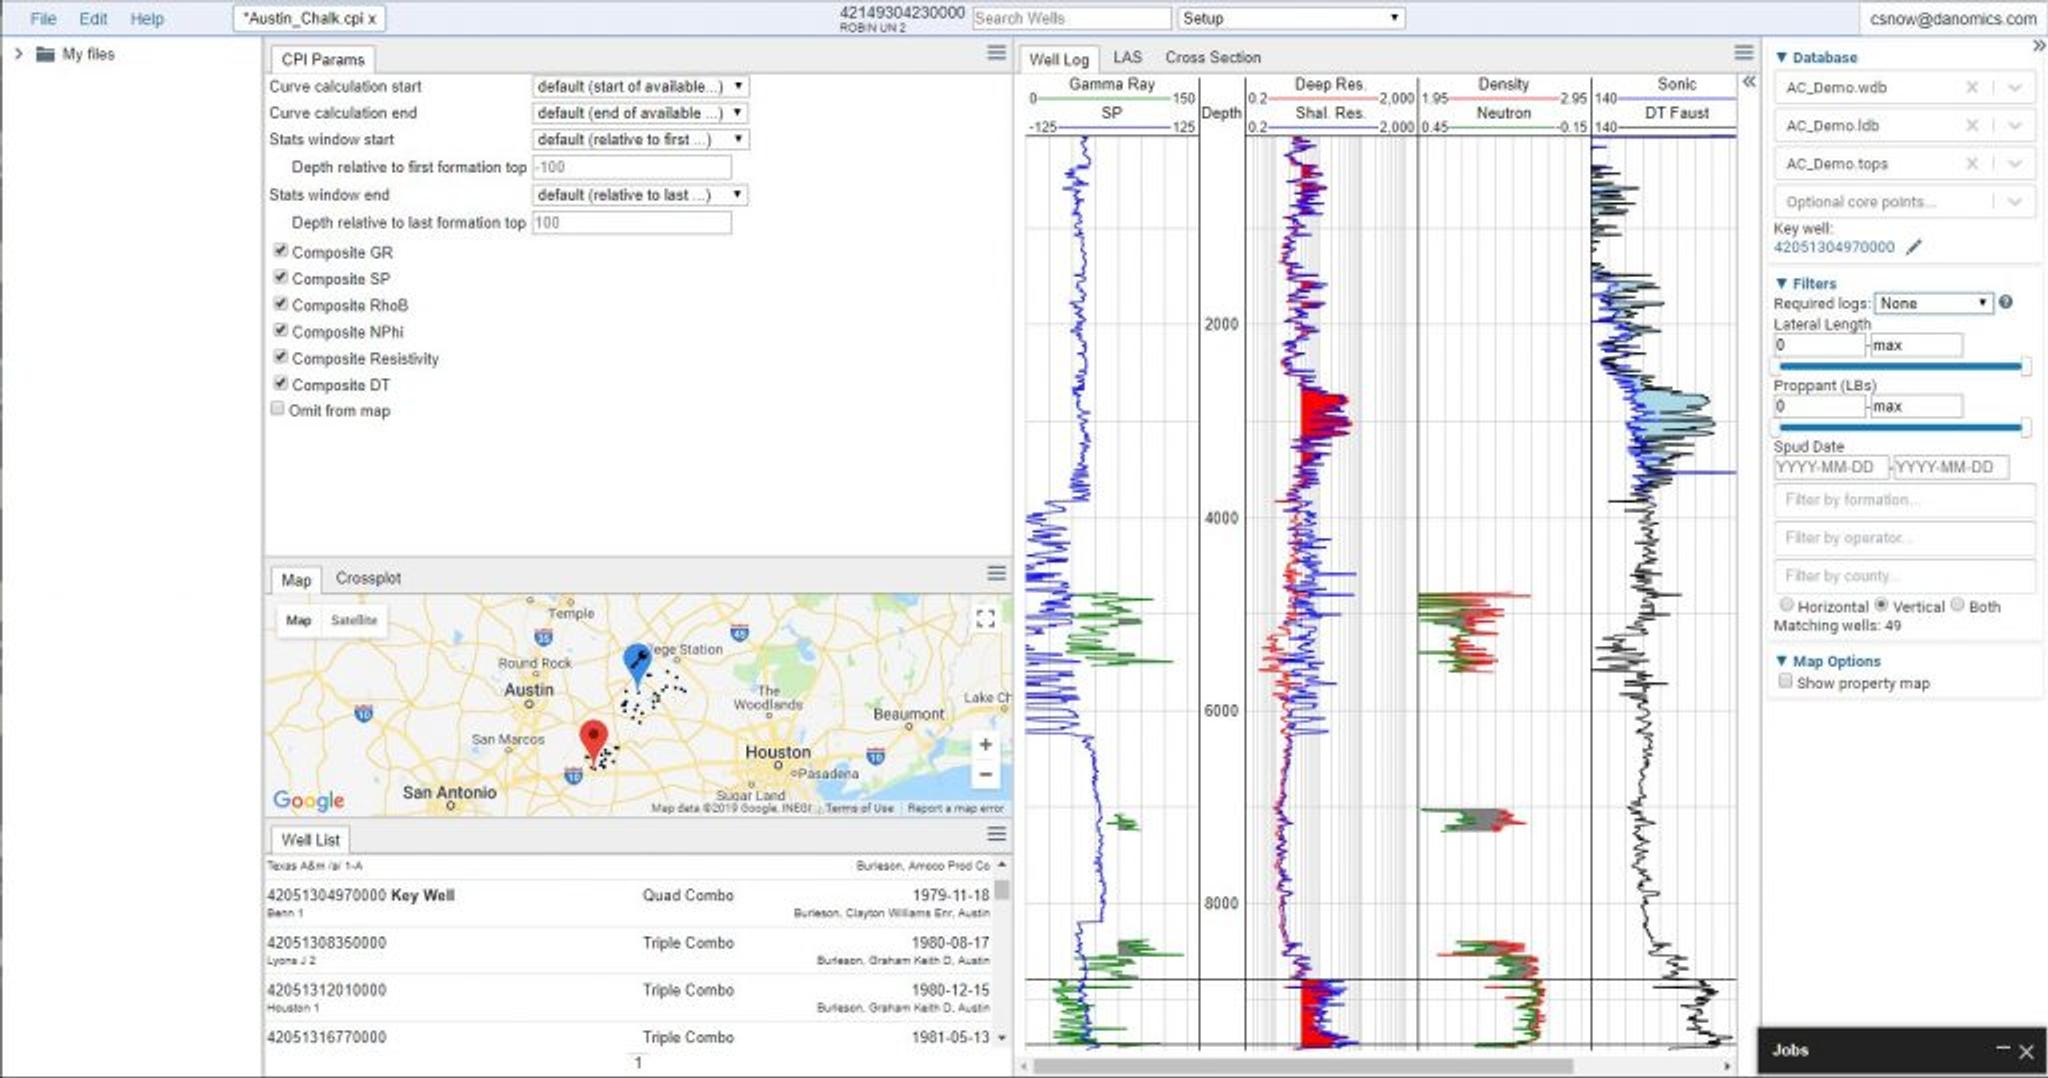
Danomics offers filtering by log availability filtering to help you find the logs that have the most comprehensive data suites, as shown below.
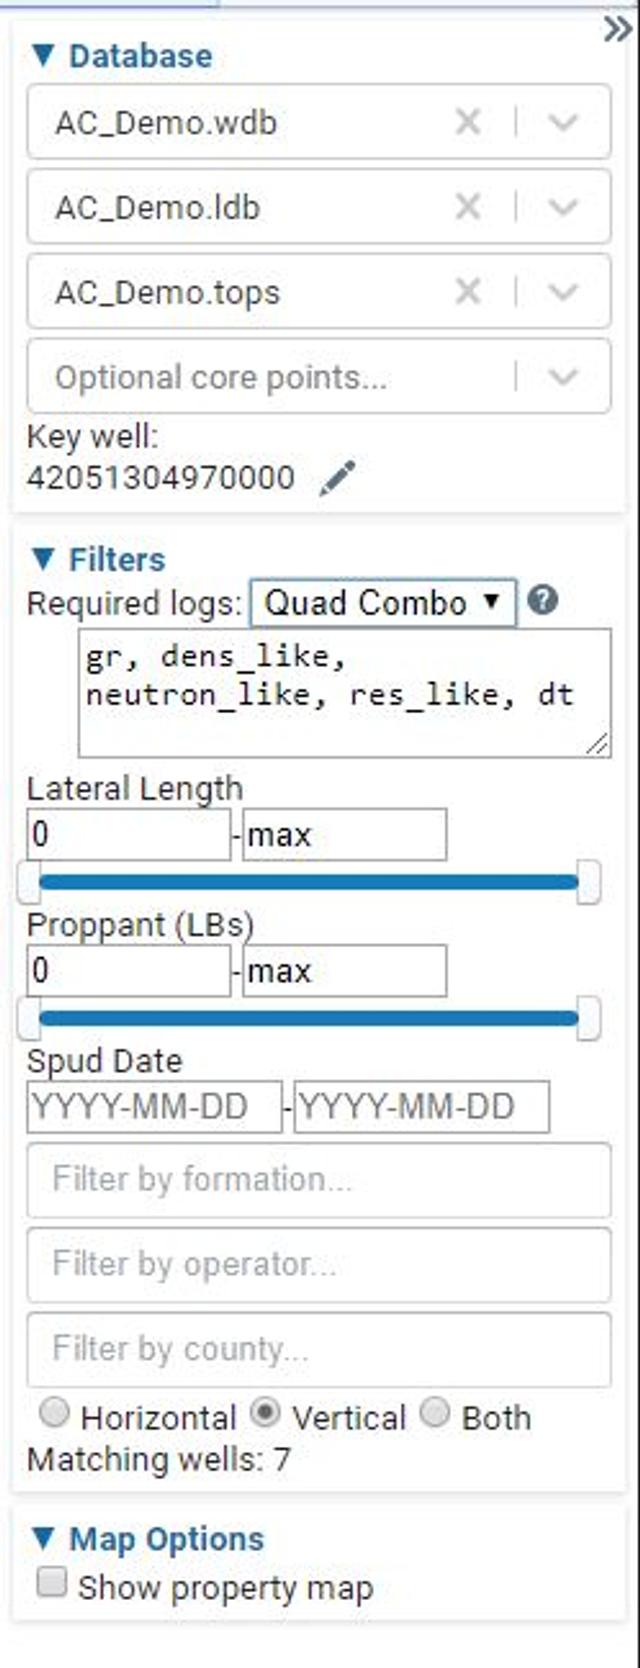
It is anticipated that filtering by formation top presence will be added in Q4 2019 so that locating wells with a complete stratigraphy will be quicker and easier.
Once you have decided on which well you want to be the key well, simply type its API number into the “Key well” box as shown in the figure above. Once you have done this, the key well will be designated with the “Key Well” label in the well list and shown in the map with a special icon.
The Petrophysical Workflow
Danomics uses a petrophysical workflow in which the user is guided through a series of modules. In order, these include:
- Set-up
- Curve Normalization
- Bad hole identification module
- Clay volume module
- TOC analysis module (optional)
- Mineral Inversion (optional; provides superior porosity results)
- Porosity analysis module
- Water saturation analysis module
- Cutoffs module
- Volumetrics module (optional)
- Pore Pressure (optional)
- Geomechanics (optional)
- 1D Geomechanical Earth Model (optional)
- Rock Physics: Shear Log Modelling (optional, recommended if evaluating geomechanics)
- Rock Physics: Fluid substituion
Each module is tied to a predefined plot that has an associated parameter entry window. Parameter entry is done on a zone-by-zone basis. Each module can be extended by the user with their own custom equations and methods by editing the CPI Config file (advanced users only).
Setting Parameters
Parameters can be set by:
- Typing parameters into entry boxes or making selections from dropdown menus or check boxes.
- Dragging and dropping parameters in a well log track (when available)
- Dragging and dropping parameters in a crossplot (when available)
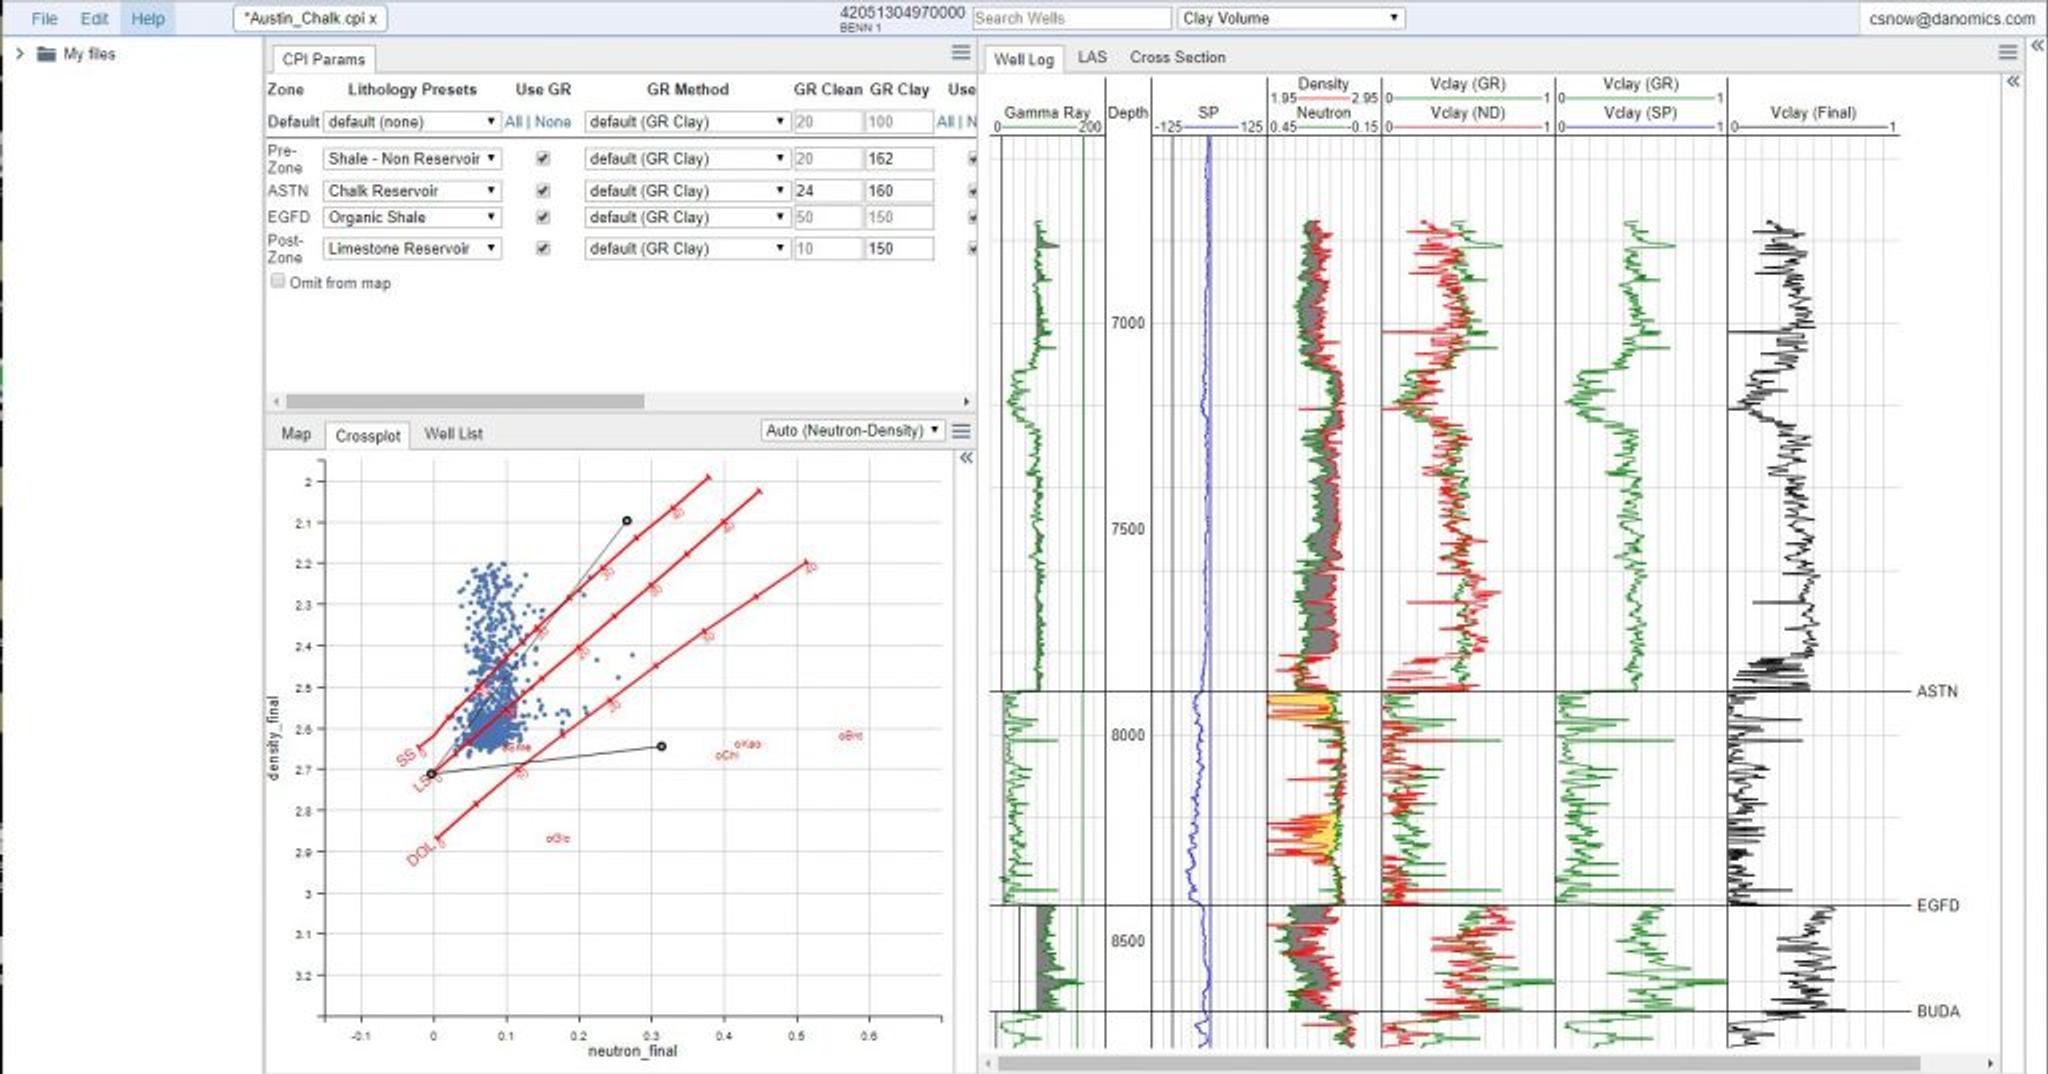
When parameters have been manually set they appear black in color. When default values are being used they appear grey in color, as shown below.
Parameters can be set well-by-well and zone-by-zone, giving the user complete control over the interpretations. The order of priority of parameter entry is as follows, from highest to lowest priority:
- Formation value manually entered/selected
- Default value manually entered/selected
- Lithology preset manually selected
- Key-well formation value, remapped
- Key-well default value, remapped
- Key-well lithology preset, remapped
- CPI Config default value, remapped
- Built-in parameters (only applies to Depth Step at present)
This means that values typed/selected directly on a zone basis are given the highest priority, followed by default values manually entered for a well. In the absence of manual entry, remapped/propagated parameters are given priority over default values when available.
Hints & Tips
Your key well analysis is what much of the subsequent analysis will be based off. Therefore it is important to take the time necessary to select an appropriate key well and tune your analysis accordingly.
Everything changes in real time. So if you want to see how changing a parameter affects your analysis there’s no need “run” button to hit.
You should save your work frequently! Don’t lose work by forgetting to save it.
Tags
Related Insights
DCA: Type well curves
In this video I demonstrate how to generate a well set filtered by a number of criteria and generate a multi-well type curve. Before starting this video you should already know how to load your data and create a DCA project. If not, please review those videos. Type well curves are generated by creating a decline that represents data from multiple wells.
DCA: Loading Production data
In this video I demonstrate how to load production and well header data for use in a decline curve analysis project. The first step is to gather your data. You’ll need: Production data – this can be in CSV, Excel, or IHS 298 formats. For spreadsheet formats you’ll need columns for API, Date, Oil, Gas, Water (optional), and days of production for that period (optional). Well header data – this can be in CSV, Excel, or IHS 297 formats.
Sample data to get started
Need some sample data to get started? The files below are from data made public by the Wyoming Oil and Gas Commission. These will allow you to get started with petrophysics, mapping, and decline curve analysis. Well header data Formation tops data Deviation survey data Well log data (las files) Production data (csv) or (excel) Wyoming counties shapefile and projection Wyoming townships shapefile and projection Haven’t found the help guide that you are looking for?